
Your AI system returns a 200 OK. Logs look clean. Latency is acceptable. But the JSON your pipeline just consumed has a hallucinated field value, a mismatched schema, and a truncated array. That's the blind spot at the center of most production AI deployments. Understanding what is AI output observability is how you close it. This article covers the core definition, the metrics that matter, the tools teams are actually using, and the practices that keep structured data pipelines reliable when your LLM decides to improvise.
Table of Contents
- What is AI output observability and why it matters
- Key metrics and signals for monitoring AI output quality
- Tools and techniques for implementing AI output observability
- Best practices for maintaining structured data integrity with AI output observability
- Comparison of traditional monitoring vs AI output observability
- Our perspective: observability without output validation is still flying blind
- Validate and repair AI outputs with datatool.dev
- Frequently asked questions
Key Takeaways
| Point | Details |
|---|---|
| AI output success ≠ accuracy | A system can respond successfully yet produce incorrect or irrelevant AI outputs requiring dedicated observability. |
| Quality metrics are essential | Hallucination rates, relevance, and faithfulness metrics identify output errors invisible to traditional monitoring. |
| Instrumentation enables insight | Tracing and logging all pipeline steps help understand and debug AI outputs effectively in production. |
| Continuous monitoring detects drift | Real-time and scheduled evaluations catch output degradation and trigger retraining to maintain data integrity. |
| AI output observability supplements traditional monitoring | Dedicated AI observability adds a quality layer needed for responsible and reliable AI system operation. |
What is AI output observability and why it matters
AI output observability is the continuous measurement and evaluation of what your AI system actually produces, not just whether it produced something. It goes beyond uptime, response time, and HTTP status codes. It asks a harder question: is the output correct, relevant, and structurally sound?
Traditional observability covers infrastructure. CPU usage, memory, latency, error rates. Those metrics tell you the system is running. They say nothing about whether the model hallucinated a field value or returned a relevance score of zero wrapped in a valid 200 response. As traditional monitoring misses output failures because a successful request can contain a completely wrong answer, AI output observability fills that gap by correlating quality metrics with infrastructure signals.
For developers working with structured data outputs, this distinction is critical. A broken JSON object that passes HTTP validation is not a network failure. It's a silent data integrity failure. The pipeline accepts it, downstream systems process it, and the error surfaces hours or days later in a database or a user-facing product.
Here's what AI output observability specifically tracks that traditional monitoring does not:
- Hallucination rate: the frequency at which the model generates plausible but factually wrong content
- Faithfulness: whether the output accurately reflects the source material or prompt context
- Relevance: how well the output addresses the actual query or task
- Schema drift: changes in output structure that break downstream parsers
- Safety violations: outputs that breach defined content or policy constraints
- Output truncation: incomplete structured objects caused by token limits or generation errors
The importance of observability in AI extends to governance as well. When your AI system operates in a regulated environment, output observability creates the audit trail that proves outputs were monitored and validated. Without it, you're flying blind on quality while having full visibility on uptime.
Understanding detecting AI output errors starts with recognizing that observability is not a feature you bolt on after deployment. It's an architectural decision made before the first production request.
Key metrics and signals for monitoring AI output quality
With the core concept established, let's examine the essential metrics and signals AI output observability actually tracks.
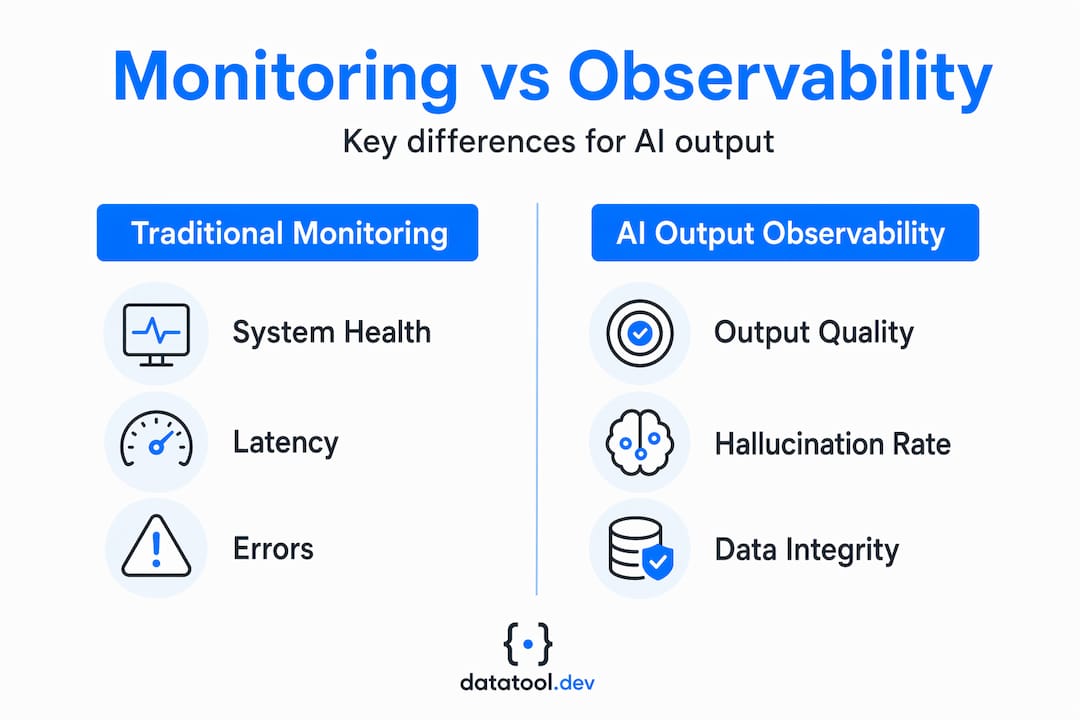
![]()
AI output observability evaluates structured data integrity via quality signals including hallucination rate and relevance scores monitored in real-time production. These are not abstract scores. Each one maps to a concrete failure mode in your pipeline.
Hallucination rate measures how often the model invents information. In a structured data context, this means field values that don't exist in the source, IDs that reference nothing, or numeric values outside any valid range. Faithfulness checks whether the model's output is grounded in the input context. Relevance measures topical alignment between the prompt and the output. Drift is subtler: it tracks whether prediction distributions are shifting over time compared to a known baseline.
| Metric | What it measures | Failure signal |
|---|---|---|
| Hallucination rate | Fabricated content frequency | Exceeds threshold per 1000 requests |
| Faithfulness score | Grounding in source context | Score drops below baseline |
| Relevance score | Topical alignment to prompt | Sustained low scores |
| Output drift | Distribution shift vs. baseline | Statistical deviation alert |
| Schema compliance rate | Structural validity of output | Parse errors spike |
| Safety violation rate | Policy or content breaches | Any non-zero count |
Vertex AI Model Monitoring detects output drift by comparing prediction distributions to configurable baselines and alerts within minutes of deviation. That kind of automated threshold alerting is what separates passive logging from active observability.
Two evaluation approaches exist: real-time inline scoring, where each output is scored as it's generated, and batch evaluation, where outputs are scored asynchronously on a schedule. Real-time scoring adds latency but catches failures immediately. Batch evaluation is cheaper and works well for non-critical pipelines or when latency budgets are tight. For structured data pipelines with strict downstream dependencies, real-time scoring is the safer choice.
NIST AI RMF's MEASURE function requires continuous monitoring of output accuracy and drift across model lifecycles with scheduled evaluations. That's not just a compliance checkbox. It's a recognition that model quality degrades silently and regularly.
Pro Tip: Set separate alert thresholds for different output types. A 5% hallucination rate might be acceptable for a summarization task but catastrophic for a pipeline generating structured financial records. Calibrate thresholds to the risk profile of each use case.
For a deeper look at AI output quality metrics, understanding how to choose the right evaluation approach for your data types is the next step.
Tools and techniques for implementing AI output observability
Having seen what metrics matter, here's how to actually collect and act on them.
-
Instrument your LLM calls with OpenTelemetry. OpenTelemetry instrumentation for LLM spans with "gen_ai` attributes enables automatic behavioral baselines and output drift detection without manual configuration. You get structured traces that capture inputs, outputs, latency, token counts, and model version in one place.
-
Deploy metacognitive probes for hallucination detection. Rotascale's Guardian monitors AI reliability issues including hallucinations and sandbagging with 96% detection accuracy using metacognitive probes in real-time. These probes work by analyzing the model's internal reasoning consistency, not just the surface output text.
-
Use session replay for agent trace debugging. Session replay of AI agent traces reconstructs execution without replaying LLM calls, storing reasoning chains critical for debugging non-reproducible output failures. This is essential when your agents involve multi-step reasoning and the failure point isn't obvious from the final output alone.
-
Build output scoring into your pipeline. Whether inline or async, every output that enters a downstream system should carry a quality score. Store it. Alert on it. Use it to build historical baselines that make drift visible over time.
-
Automate threshold tuning. Static thresholds go stale as model behavior shifts. Tools that automatically recalibrate thresholds based on rolling baselines reduce alert fatigue and keep your observability system accurate without constant manual tuning.
Pro Tip: Start with AI output testing methods before deploying observability at scale. Unit tests on representative output samples reveal the failure modes worth monitoring, which helps you configure more accurate thresholds from day one.
The key principle across all these tools: observability is a pipeline feature, not a dashboard feature. Data that doesn't flow into your alerting and debugging systems has no operational value, no matter how sophisticated the tool that captures it.
Best practices for maintaining structured data integrity with AI output observability
With instrumentation and tooling in place, these practices maintain output quality over time.
AI observability requires setting quality thresholds, continuous monitoring, retraining on drift detection, and asynchronous scoring to detect subtle failures before they reach users. That's the full operational loop. Here's how each step works in practice:
- Establish baseline quality thresholds before go-live. Run your model against a labeled evaluation set. Record hallucination rate, faithfulness, relevance, and schema compliance. These numbers become your production baseline. Any sustained deviation is a signal to investigate.
- Score outputs inline for high-stakes pipelines. If downstream data consumers expect valid structured objects, every output must be validated before it's accepted. Async scoring is useful for analysis, but it can't prevent a malformed record from entering your database.
- Trigger retraining on confirmed drift. Automated retraining on feature shifts exceeding thresholds preserves structured data integrity in production AI inference. Don't wait for user complaints. Your metrics should trigger the intervention.
- Maintain full audit trails. Log every input, output, quality score, and model version. This supports debugging, compliance, and post-incident analysis. Without logs, reproducing a failure is nearly impossible.
- Apply human-in-the-loop validation for ambiguous cases. Automated scoring is accurate but not perfect. Outputs that fall in borderline quality ranges benefit from human review, especially when the cost of a wrong decision is high.
A practice many teams skip: validating that your observability system itself is working correctly. Test your alerts. Inject known bad outputs and confirm they trigger. Observability infrastructure that fails silently is worse than no observability at all.
Visit the testing best practices guide for structured test design that pairs cleanly with observability pipelines.
Comparison of traditional monitoring vs AI output observability
Now that we've explored AI observability in depth, contrasting it with traditional monitoring makes its role concrete.
| Capability | Traditional monitoring | AI output observability |
|---|---|---|
| Tracks latency and error rates | Yes | Yes |
| Validates output content | No | Yes |
| Detects hallucinations | No | Yes |
| Monitors schema compliance | No | Yes |
| Captures output lineage | No | Yes |
| Alerts on quality degradation | No | Yes |
| Supports model governance | Limited | Yes |
Traditional monitoring tracks latency, error rates, and throughput but misses output quality issues like hallucinations or irrelevance entirely. That's not a criticism of traditional monitoring. It was never designed for probabilistic systems that generate novel text.
"Monitoring confirms system presence. AI observability confirms system correctness and output validity, essential as AI models are black boxes without it."
That framing is useful. Traditional monitoring answers "is it running?" AI output observability answers "is it right?" Both questions matter. Only one of them protects your data.
For AI developers working with LLM pipelines that emit structured JSON, this distinction has immediate practical consequences. A model that runs fast but produces invalid objects is worse than no model at all. The speed creates false confidence while the errors accumulate silently.
Understanding detecting errors vs errors present is the difference between a reactive debugging workflow and a proactive quality system.
Our perspective: observability without output validation is still flying blind
Most teams implementing AI observability start with the right instinct but stop too early. They instrument their LLM calls, set up latency dashboards, and call it done. What they miss is the layer directly below the surface: what the output actually says, and whether it's structurally usable.
Here's the uncomfortable reality. An AI observability stack that tracks hallucination rates but doesn't validate the JSON structure of its outputs is solving half the problem. Schema drift is one of the most common and most damaging failure modes in production LLM pipelines. It doesn't show up in quality scores. It shows up in broken parsers, corrupt records, and downstream system failures that take days to trace back to the model.
The teams who handle this well treat output observability and output validation as the same pipeline stage, not separate concerns. Every output is scored for quality and checked for structural integrity before it moves downstream. When one check fails, both signals are available for debugging.
There's also a discipline gap here that's worth naming directly. Data engineers often own the downstream pipeline but don't own the model. AI developers own the model but don't always see what happens to their outputs after generation. AI output observability is the shared layer that gives both teams visibility into the same failure. Without it, the blame game between "the model was fine" and "the data was broken" continues indefinitely.
Build observability as a shared contract between model owners and data pipeline owners. Agree on the quality metrics that matter. Agree on the structural validity rules. Then instrument both. That's the version of AI output observability that actually reduces production incidents.
Validate and repair AI outputs with datatool.dev
If your observability stack is catching output failures but you still need to fix them fast, that's where datatool.dev fits in. The platform is built specifically for malformed AI output: broken JSON, wrapped responses, partial objects, invalid escaping, truncation, and schema drift.
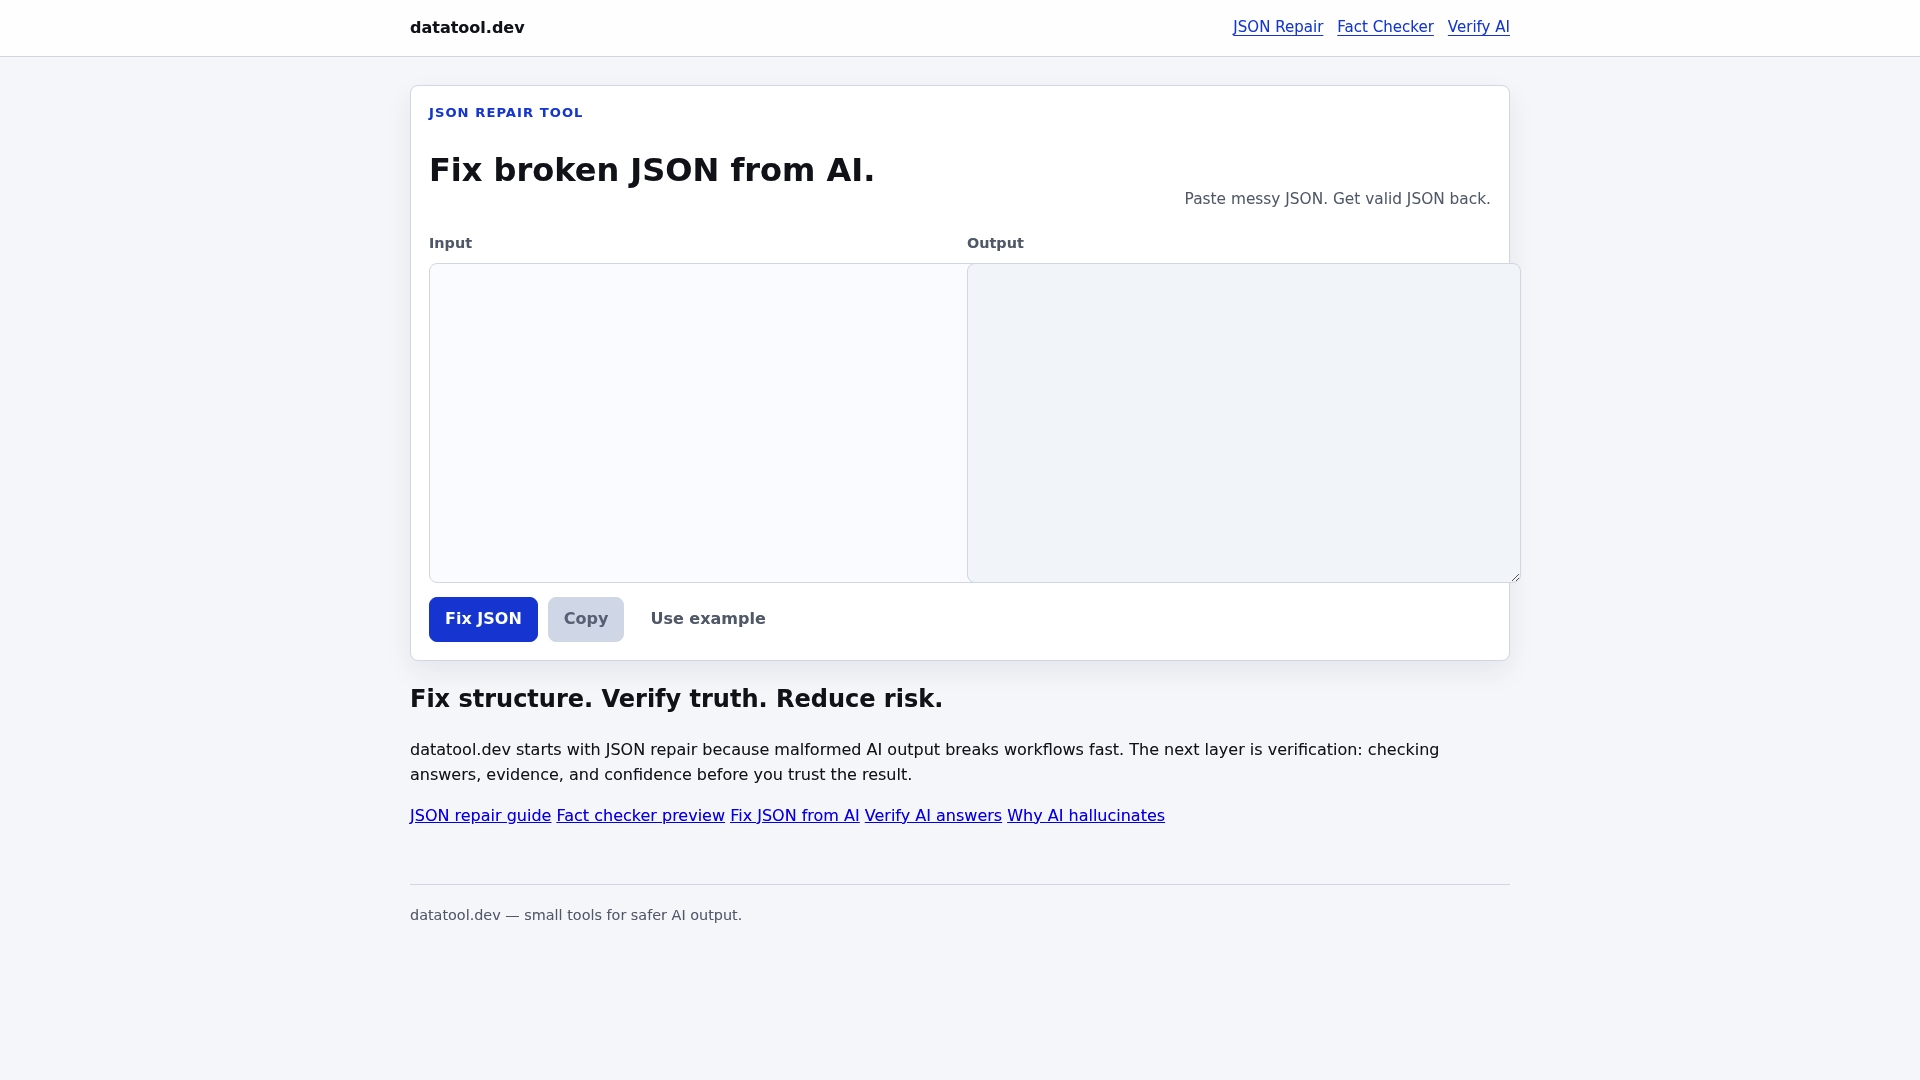
You don't need to write custom repair logic or debug LLM quirks by hand. Paste your malformed output and get valid, schema-compliant JSON back. datatool.dev handles the repair, validation, and testing workflow in one place, built for the exact failure modes your observability stack is flagging. Less time fixing broken output. More time trusting what your pipeline produces.
Frequently asked questions
What distinguishes AI output observability from traditional monitoring?
Traditional monitoring tracks latency and error rates but misses quality failures like hallucinations or irrelevant outputs. AI output observability adds quality scoring, schema validation, and drift detection on top of infrastructure metrics.
How can AI developers detect hallucinations in production outputs?
By continuously scoring outputs for hallucination rates using automated evaluation functions applied in real-time or async, developers can trigger alerts when reliability drops below defined thresholds.
Why is output drift monitoring important in AI systems?
Vertex AI Model Monitoring detects output drift by comparing prediction distributions against baselines and alerting within minutes of deviation, enabling retraining before user experience degrades.
What tools assist in implementing AI output observability?
OpenTelemetry for LLM span tracing, metacognitive probes like Rotascale's Guardian detection accuracy, and session replay systems for agent trace debugging form the core instrumentation stack for most production deployments.
How often should AI output quality be evaluated in production?
Continuous inline monitoring is ideal for structured data pipelines. NIST AI RMF's MEASURE function also recommends scheduled batch evaluations weekly or biweekly to catch subtle degradations that real-time scoring may not surface.