
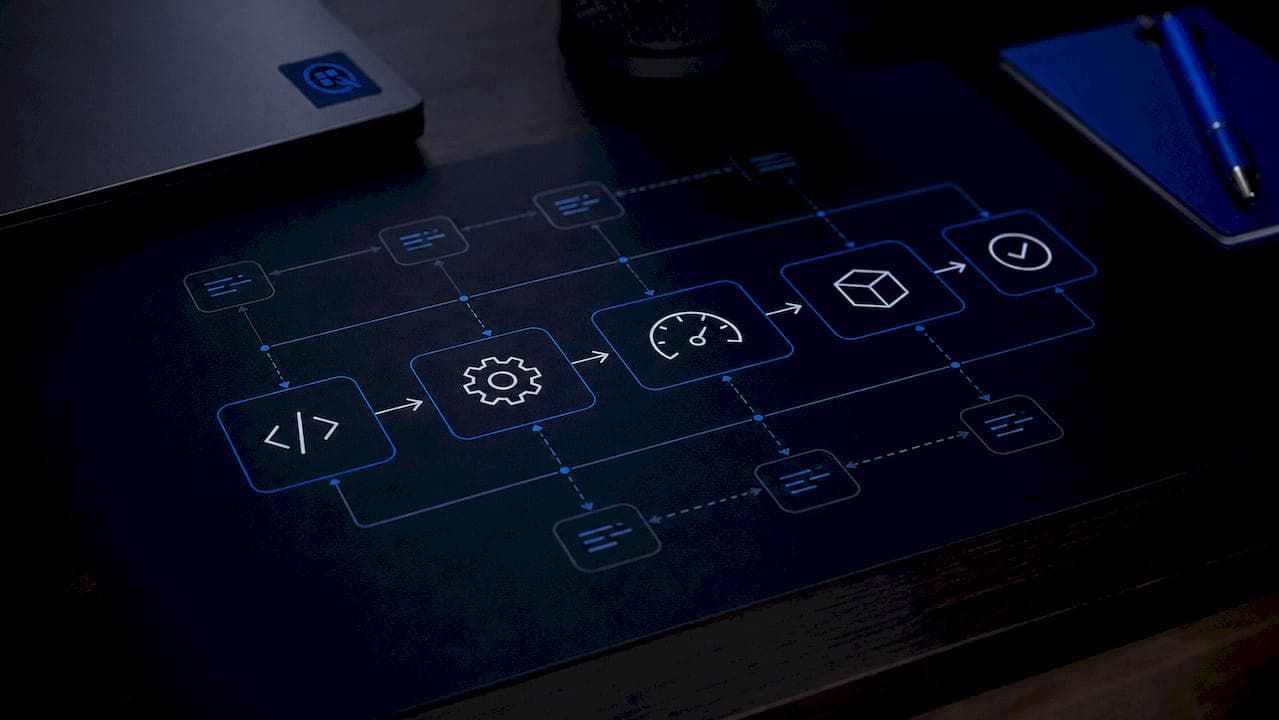
Developer toolchain optimization is the process of assembling and refining a set of integrated tools and techniques to improve development speed, product quality, and build performance. The most effective developer toolchain optimization list in 2026 combines a well-chosen modern stack with advanced compiler techniques and targeted workflow friction reduction. Tools like GitHub Actions, Supabase, Sentry, and Railway now form a baseline modern stack that covers roughly 90% of typical product shipping needs. Getting the selection right before tuning anything else is the single highest-leverage decision you can make.
1. What are the best modern tools for your developer toolchain?
The right toolchain covers every workflow stage without redundancy. The standard 2026 stack includes AI coding assistants, project management, deployment, databases, monitoring, and CI/CD automation. Here is a stage-by-stage breakdown:
- AI coding assistants: Cursor ($20/month) and GitHub Copilot ($10/month) both accelerate code generation. Cursor fits solo developers who want deep context; Copilot integrates tightly with GitHub workflows.
- Project management: Linear handles sprint planning and issue tracking with minimal overhead. It suits small teams and scales to larger ones without becoming a burden.
- Deployment: Railway handles containerized deployments with near-zero configuration. It is the fastest path from code to production for most web apps. See this deployment pipeline guide for CI/CD integration patterns.
- Databases: Supabase provides a managed Postgres backend with built-in auth and storage. For a broader comparison of options, the database options guide covers trade-offs across managed and self-hosted solutions.
- Monitoring: Sentry captures runtime errors with full stack traces and release tracking. It pays for itself the first time it catches a production bug before a user reports it.
- CI/CD: GitHub Actions runs tests, builds, and deployments on every push. It is free for public repos and cost-effective for private ones.
Pro Tip: Audit your toolchain one workflow stage at a time. Trying to replace everything at once creates confusion and makes it impossible to measure what actually improved.
2. How to apply profile-guided optimization to cut build times

Profile-guided optimization (PGO) is the most reliable way to extract real performance from a compiler. Standard flags like -O3 are insufficient alone. Without realistic execution data, the optimizer works blind and misses the hottest code paths.
The PGO workflow has three steps:
- Instrument the binary. Compile with profiling enabled. Run the binary against a realistic workload that reflects actual production usage.
- Collect the profile. The instrumented run produces a
.profdatafile (LLVM) or.pgdfile (MSVC) that records which branches and functions execute most often. - Recompile with the profile. The compiler uses this data to inline aggressively, reorder code, and eliminate cold paths. The result is a binary tuned to your actual workload.
Combined with post-link optimization tools like BOLT, PGO delivers up to 1.5x performance improvements on complex workloads compared to -O3 alone. BOLT works after linking by reordering functions in memory to reduce instruction cache misses.
A critical maintenance detail: a 3–5% drop in "Total Dynamic Instructions Optimized" signals stale profile data. Stale profiles produce suboptimal binary layouts and can negate expected gains entirely. Refresh profiles on a schedule tied to your release cycle.
Pro Tip: Add profile collection as an automated step in your CI pipeline. Treat it like a test suite, not a one-off task.
| Technique | Benefit | When to apply |
|---|---|---|
| PGO | Up to 1.5x runtime speedup | After code stabilizes pre-release |
| BOLT | Reduced instruction cache misses | Post-link, on large binaries |
| Host-specific GCC build | 12–24% compile time reduction | Large or frequent build environments |
| BuildKit cache mounts | Faster incremental Docker builds | Any containerized CI/CD pipeline |
3. Build pipeline tuning that actually reduces wait time
Build pipeline tuning targets the time between git push and a deployable artifact. Effective techniques include measuring baseline build times first, then attacking the biggest bottlenecks in order.
Start with your .dockerignore file. A bloated build context sends unnecessary files to the Docker daemon on every build. Trimming it reduces context transfer time immediately. Next, enable BuildKit cache mounts to persist dependency caches across builds. Layer order matters: copy dependency manifests (package.json, go.mod) before source code so Docker reuses cached dependency layers on most builds.
Building GCC with host-specific optimizations, LTO, and PGO during bootstrap cuts compiler run time by 12–24%. The initial investment is real, but it pays off quickly in environments with large or frequent builds. Multi-stage Docker builds keep final images small and separate build dependencies from runtime dependencies cleanly.
Here is a concrete example of a common mistake and its fix:
# BROKEN: copies all source before installing dependencies
COPY . .
RUN npm install

# FIXED: install dependencies first, then copy source
COPY package.json package-lock.json ./
RUN npm install
COPY . .
The broken version busts the dependency cache on every source change. The fixed version only reinstalls dependencies when package.json changes.
4. How reducing invisible friction boosts developer productivity
Invisible friction includes slow tools, repetitive context switching, and inefficient terminal workflows. It reduces productivity more than the hours spent on genuinely hard problems. The damage is cumulative and hard to see until you measure it.
"The tools that reduce invisible friction have the most impact on productivity over months, not hours. Switching IDEs gets attention. Fixing your directory navigation does not. But the latter saves more time."
Concrete fixes that compound over time:
- Zoxide replaces
cdwith frequency-weighted directory jumping. You typez projinstead ofcd ~/work/clients/project-name/src. - Raycast (macOS) handles snippet expansion, clipboard history, and app switching from one keyboard shortcut. It eliminates dozens of small context switches per day.
- YubiKey 5 handles hardware-backed SSH and GPG authentication. It removes the credential management friction that interrupts flow at the worst moments.
These tools do not look impressive in a demo. They look impressive in your git commit history three months later. For a broader look at developer productivity tooling, the patterns hold across team sizes.
5. AI-driven auto-tuning for workload-specific compiler performance
Generic compiler flags produce generic results. NVIDIA CompileIQ represents a different approach: multi-objective evolutionary algorithms that tune compiler internals for specific kernels and workloads.
The framework balances three objectives simultaneously:
- Runtime performance: How fast the compiled binary executes the target workload.
- Compile time: How long the build takes, which affects CI/CD cycle times.
- Power consumption: Relevant for GPU workloads and battery-constrained environments.
Instead of applying generic heuristics, CompileIQ generates workload-specific configurations. The result is better performance and efficiency than any static flag set can achieve. This approach currently targets AI and HPC workloads, but the underlying multi-objective optimization model is moving into broader compiler ecosystems. Expect workload-specific compiler configurations to become standard practice within two to three years.
Key takeaways
A well-structured toolchain, combined with PGO and friction reduction, produces more measurable productivity gains than any single tool switch.
| Point | Details |
|---|---|
| Start with a complete baseline stack | Cover all six workflow stages before tuning individual tools. |
| Use PGO with realistic workloads | Instrument, profile, and recompile on a schedule tied to your release cycle. |
| Tune Docker build layers | Separate dependency manifests from source to maximize cache reuse. |
| Reduce invisible friction first | CLI tools like Zoxide and Raycast save more time than marginal tool upgrades. |
| Refresh profiles regularly | A 3–5% drop in optimized instructions signals stale PGO data. |
What I've learned about prioritizing toolchain work
Most developers chase the wrong gains. They spend a weekend evaluating a new IDE and ignore the fact that their Docker builds take four minutes because nobody ever fixed the layer order. The compiler flag rabbit hole is real too. I've watched teams spend days benchmarking -O3 vs. -O2 while their CI pipeline had no caching at all.
The sequence matters. Get your baseline stack right first. Then fix the build pipeline. Then add PGO once the code is stable enough to produce a representative profile. Invisible friction reduction runs in parallel with all of this. It costs almost nothing to install Zoxide and set up Raycast, and the payoff starts the same day.
The one habit that separates teams with fast, reliable builds from teams with slow, fragile ones is habitual profiling. Not occasional profiling. Not profiling before a release. Automated profiling on every meaningful build, with alerts when the numbers drift. That discipline is what keeps optimizations relevant as code changes. Everything else is a one-time fix that decays.
— Gregory
Datatool and AI-generated data in your toolchain
As AI coding assistants become standard in developer toolchains, the structured data they generate needs the same rigor you apply to your build pipeline. LLMs produce broken JSON, truncated objects, and schema drift at a rate that surprises most teams the first time they hit production.
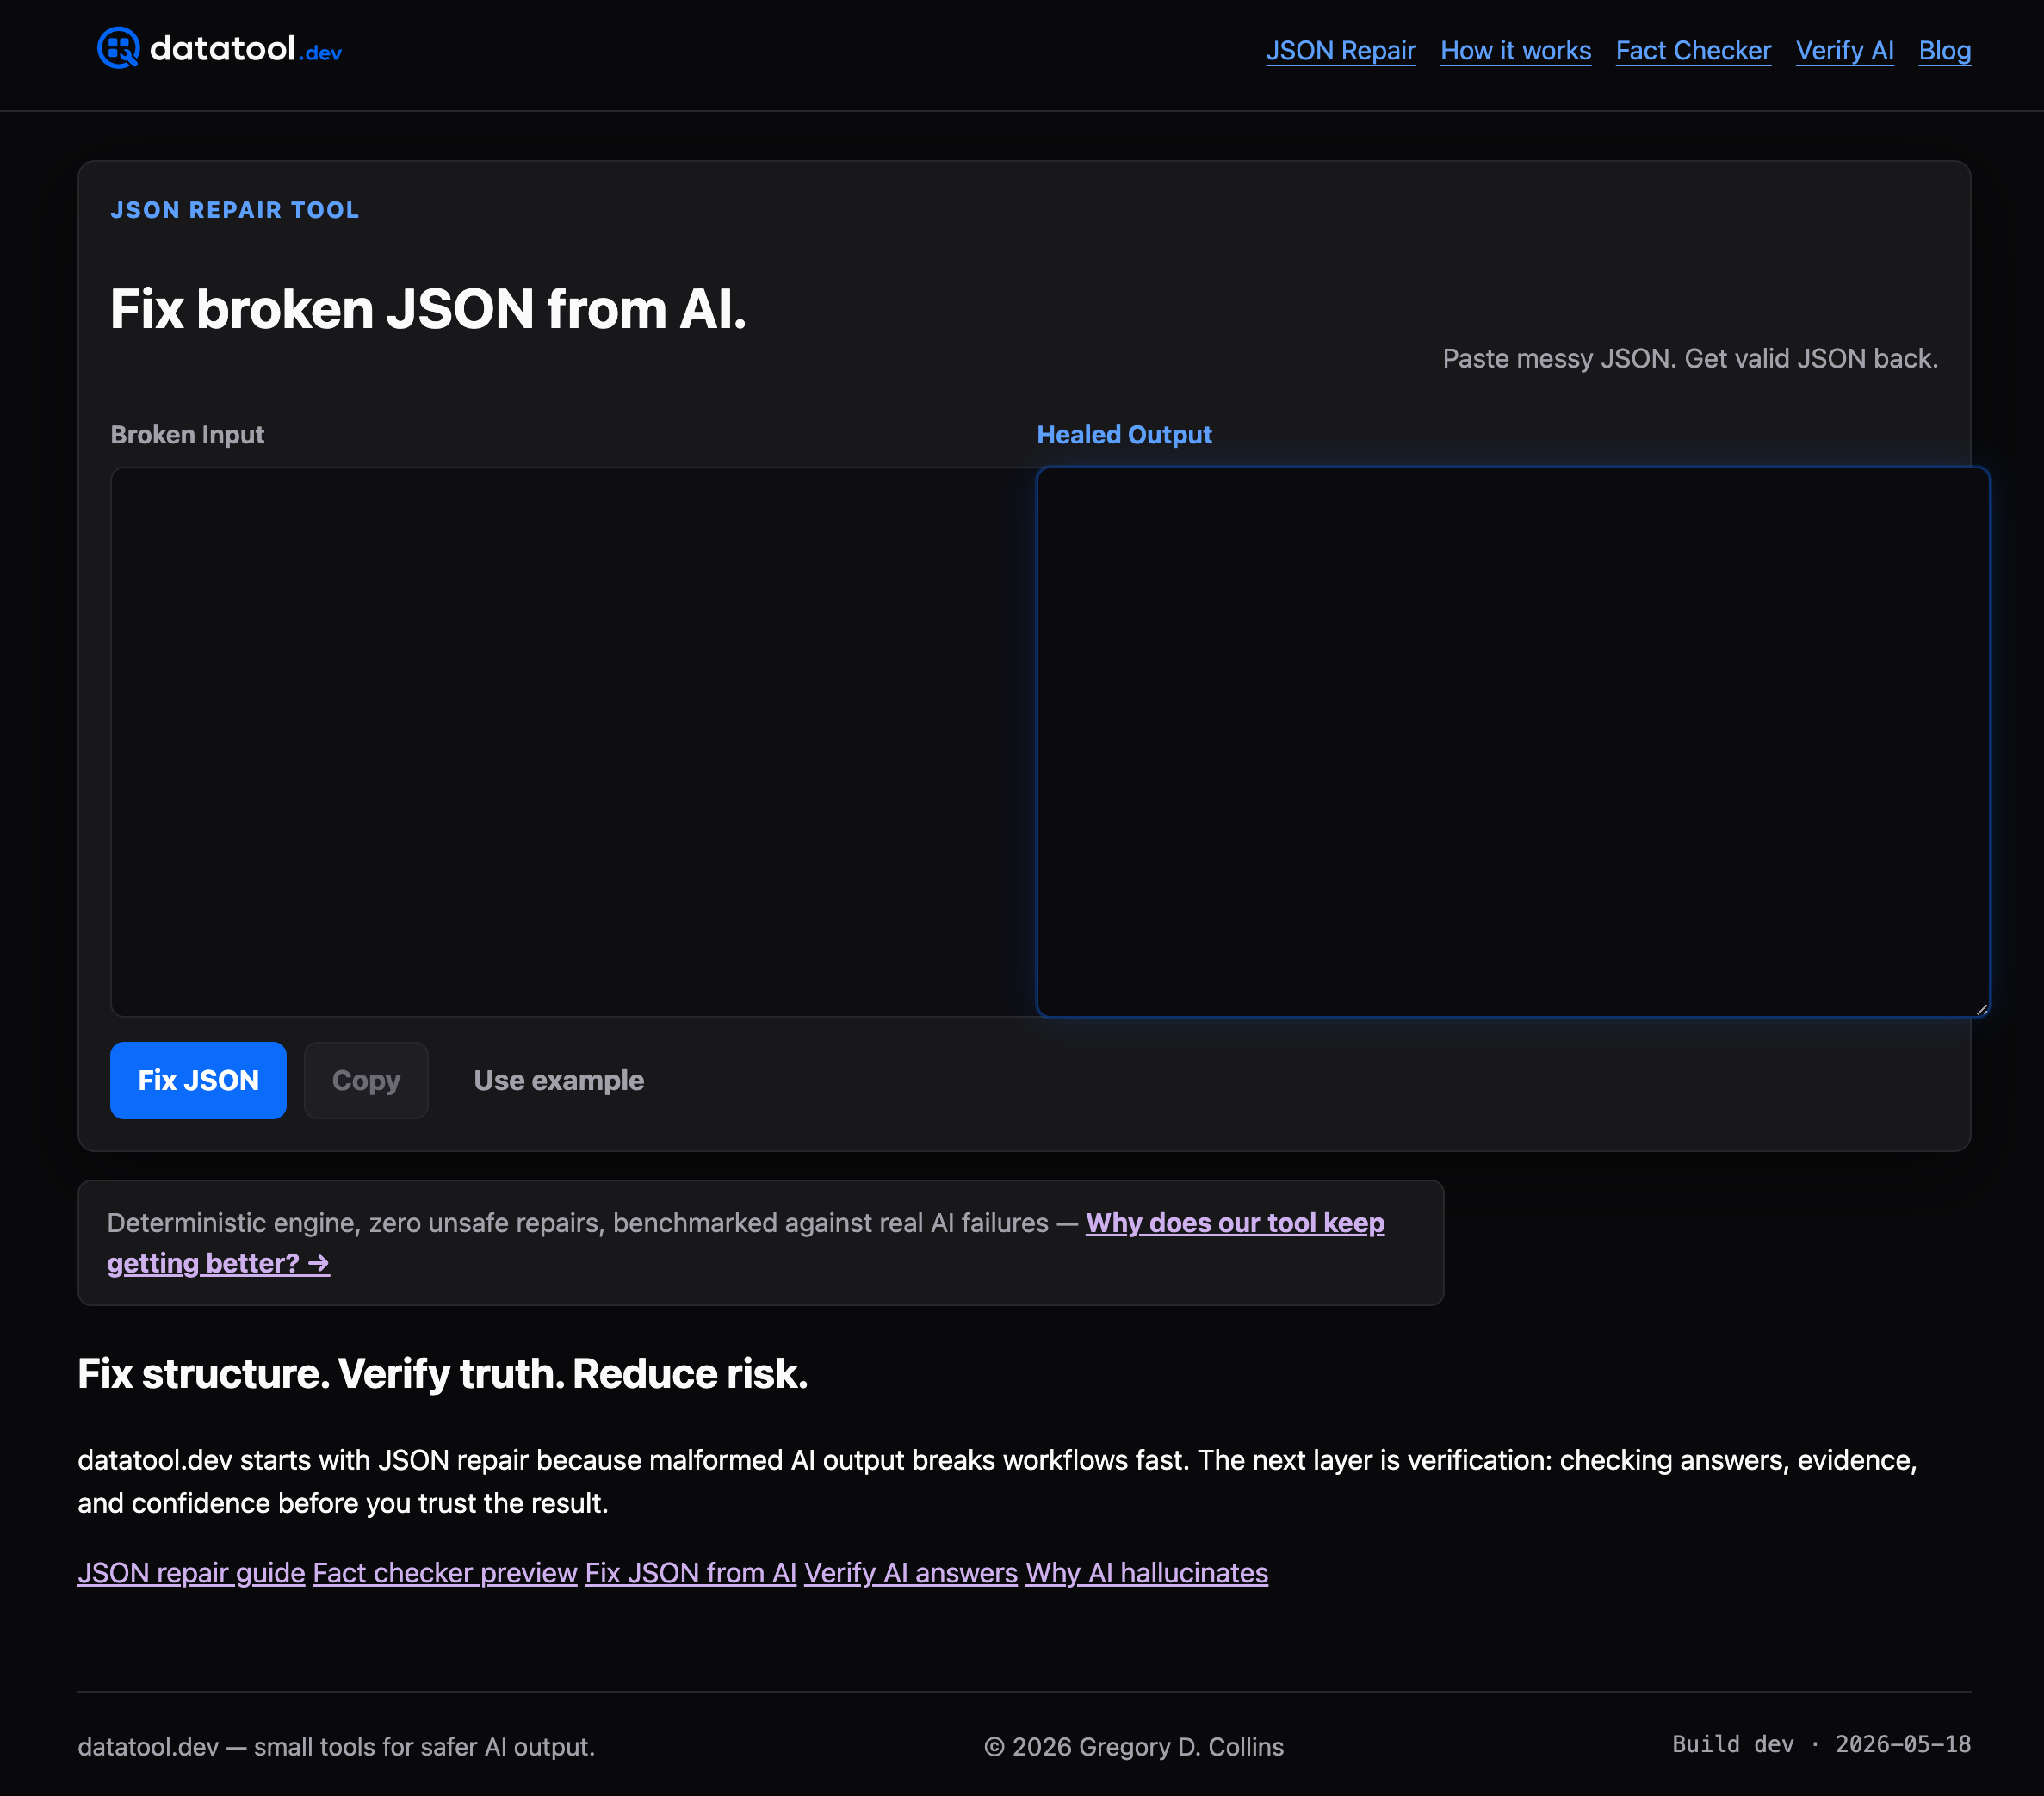
Datatool is built specifically for this problem. It repairs and validates malformed AI output, including broken JSON, wrapped responses, partial objects, and invalid escaping. Teams integrating tools like Cursor or GitHub Copilot into their workflows use Datatool to catch bad output before it reaches production. Visit datatool.dev to fix broken JSON from AI and build more reliable AI-driven pipelines.
FAQ
What is developer toolchain optimization?
Developer toolchain optimization is the process of selecting, configuring, and tuning a set of integrated development tools to improve build speed, code quality, and developer productivity. It covers everything from CI/CD pipelines to compiler flags and workflow friction reduction.
How much can PGO improve build performance?
Profile-guided optimization combined with post-link tools like BOLT delivers up to 1.5x performance improvements on complex workloads compared to using -O3 alone. Results vary by codebase and workload characteristics.
How often should I refresh PGO profiles?
Refresh profiles whenever a 3–5% drop in optimized instructions appears, or on a fixed schedule tied to your release cycle. Stale profiles produce suboptimal binaries and can negate expected performance gains.
What is invisible friction in developer workflows?
Invisible friction refers to small, repeated slowdowns like slow directory navigation, credential prompts, and context switching that accumulate into significant productivity loss over weeks and months. CLI tools like Zoxide and hardware security keys like YubiKey 5 address these directly.
What tools form a solid 2026 developer baseline stack?
The standard 2026 baseline includes Cursor or GitHub Copilot for AI assistance, Linear for project management, Railway for deployment, Supabase for databases, Sentry for monitoring, and GitHub Actions for CI/CD.