

AI API integrations break in ways that traditional debugging tools never anticipated. You get silent failures, malformed JSON responses, multi-agent orchestration errors, and cost spikes with no clear trace pointing to the cause. The debugging tools for AI API integrations available in 2026 have matured considerably, but picking the wrong one for your stack still costs weeks. This guide covers tool selection, integration setup, common failure patterns, and verification strategies so you can stop guessing and start fixing.
Table of Contents
- Key takeaways
- Debugging tools for AI API integrations
- Setting up observability in your API workflows
- Common failures and how to fix them
- Verification and validation strategies
- My take on where AI debugging is heading
- Fix malformed AI output with Datatool
- FAQ
Key takeaways
| Point | Details |
|---|---|
| Match tools to project scale | Low-code platforms deploy in days; enterprise setups like MuleSoft require months and deep technical expertise. |
| Record production traces first | Capture real failure traces before attempting fixes, then replay them in sandboxed environments to prevent regressions. |
| Malformed output breaks pipelines | AI-generated structured data with broken JSON or schema drift causes silent failures that standard loggers miss. |
| CI/CD gating prevents regressions | Block merges automatically when AI evaluation scores drop below defined thresholds using tools like Braintrust. |
| Instrument early, not after launch | Adding observability after deployment is far more costly and time-consuming than building it in from the start. |
Debugging tools for AI API integrations
Not every tool fits every project. API integration platforms range from Zapier at roughly $2 per month to MuleSoft at over $100,000 annually with deployment cycles measured in months. The technical lift varies just as much. Before you install anything, know where your project sits on that spectrum.
Here is a practical comparison of the leading AI debugging software options in 2026:
| Tool | Best for | Key strength | Limitation |
|---|---|---|---|
| Braintrust | CI/CD evaluation gating | GitHub Actions integration, eval scoring | Setup complexity for small projects |
| Workshop | Local agent tracing | Streams tokens, tool calls, costs to localhost | Limited production-scale monitoring |
| LangSmith | LangChain-native observability | Deep chain tracing | Vendor lock-in for non-LangChain stacks |
| Langfuse | Open-source observability | Self-hostable, full trace visibility | Requires more manual configuration |
| Helicone | Cost and latency tracking | Proxy-based request capture | No built-in regression workflow |
Workshop runs locally inside desktop environments like Cloudflare containers, streaming token counts, tool calls, and costs directly to localhost ports. That makes it the fastest option for catching agent misbehavior during development before anything hits production.
Pro Tip: Evaluate tools based on two factors: whether they support your framework natively (LangChain, CrewAI, custom agents) and whether they export traces in a format your CI/CD pipeline can consume.
Setting up observability in your API workflows
Getting useful debugging data out of an AI API integration requires deliberate instrumentation. Here is a practical setup sequence:
-
Wrap your API client with a logging proxy. Helicone works as a proxy capturing requests and responses, latency, cost, and session-level metadata for every AI API call. Add it with a one-line base URL change.
-
Attach trace IDs to every request. Without a consistent trace ID, multi-step agent failures are impossible to reconstruct. Pass a "session_id
andtrace_id` in your request headers. -
Capture the raw response before parsing. This is where most teams skip a step. Here is what a basic capture looks like:
import requests, json, logging

def call_ai_api(prompt):
    raw = requests.post(API_URL, json={"prompt": prompt}, headers=HEADERS)
    logging.info("RAW_RESPONSE: %s", raw.text)
    try:
        return raw.json()
    except json.JSONDecodeError as e:
        logging.error("PARSE_FAILURE: %s | Raw: %s", e, raw.text[:500])
        raise
The logging.info line before the parse attempt is what saves you. When the model returns a truncated JSON object or a markdown-wrapped response, you have the exact bytes that caused the failure.
-
Set up Braintrust evaluation gating in CI/CD. Braintrust integrates with GitHub Actions to block merges when evaluation scores drop below your defined threshold. This turns every production trace into a regression test.
-
Use Workshop for local agent tracing. Run it alongside your dev environment to see every token, every tool call, and associated costs in real time before a single request leaves your machine.
Pro Tip: Use pre-built REST API connectors with authentication and pagination baked in to cut integration time significantly. Do not hand-roll HTTP clients for standard model APIs.
Common failures and how to fix them
Most AI API integration bugs fall into a small number of repeatable categories. Knowing the pattern tells you where to look.
Silent task drops. Lower-tier plans on platforms like Zapier do not send proactive failure alerts when task limits are exhausted. Your workflow silently stops processing. Fix: add explicit error webhooks and monitor task consumption metrics, not just success rates.
Malformed structured output. LLMs return broken JSON more often than people expect. Truncated objects, invalid escape sequences, markdown code fences wrapping JSON, schema drift across model versions. Standard JSON parsers throw and give you nothing useful. You need to detect malformed output before it propagates downstream.

Multi-agent orchestration failures. When one agent hands off to another and the second agent fails, the error often surfaces three steps later with a misleading message. IDE-integrated tools like Copilot cannot diagnose this class of failure. You need cross-session trace replay.
Unexpected model behavior. You can inspect network traffic to reveal the actual model endpoint being called. Proprietary tools sometimes wrap commoditized models without clear disclosure. If your outputs changed unexpectedly, check what model is actually answering your requests.
Converting production failure traces into automated test cases is the single highest-leverage practice in AI API debugging. One production failure becomes permanent regression coverage.
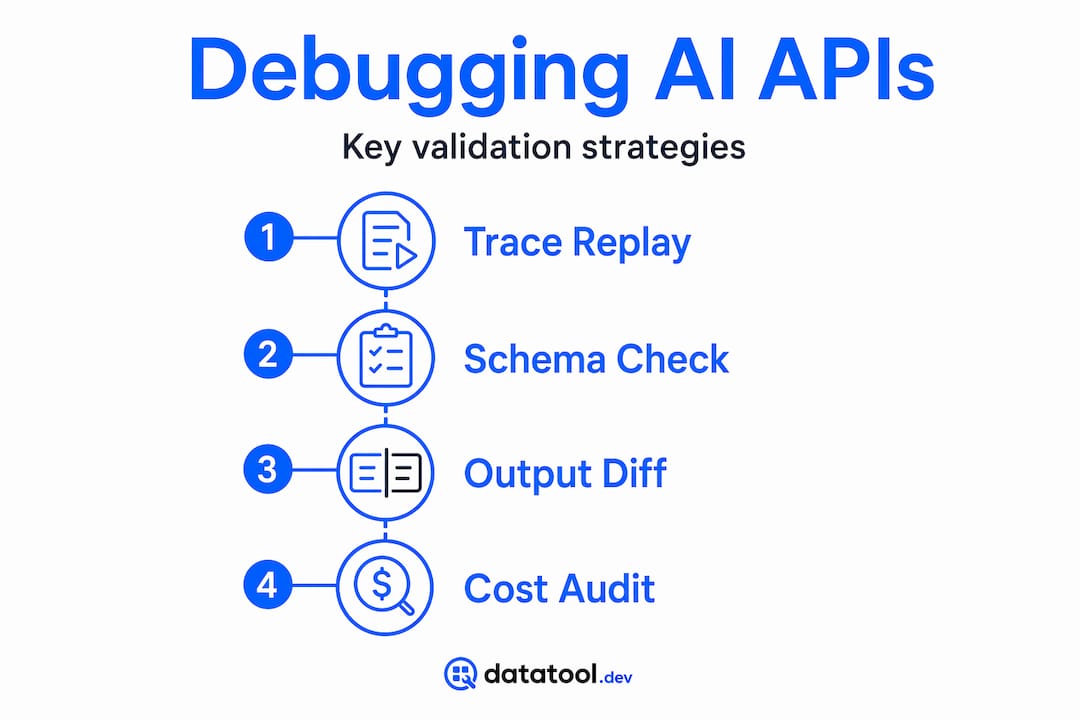
Pro Tip: When a session-level anomaly appears, check cost-per-request in Helicone first. A 10x cost spike on a single session almost always points to an infinite tool-call loop or a context window overflow.
Verification and validation strategies
Fixing a bug once is not enough. You need to confirm the fix holds and that it does not break anything adjacent.
-
Replay failures in a sandbox. The most effective debugging flows record production traces and replay them in isolated environments. This lets you verify a fix without making live API calls and incurring costs.
-
Write unit tests against AI output schemas. Do not just test that a response arrived. Test that the response matches your expected schema. Datatool's guide on unit testing AI-generated data walks through practical validation patterns for structured output.
-
Gate CI/CD on evaluation scores. Braintrust's GitHub Action blocks merges when passing thresholds are not met. Set per-eval thresholds based on criticality, not a single global score.
-
Set alerts on error rate and latency percentiles. Monitoring average latency hides the spikes that users actually experience. Alert on p95 and p99 latency, not just the mean.
-
Maintain data contracts between services. Schema drift across model versions kills integrations silently. Version your output schemas and validate against them on every response. The AI output testing practices documented by Datatool cover schema versioning approaches that work in production.
| Verification method | What it catches | Tool fit |
|---|---|---|
| Sandbox trace replay | Regression on known failures | Braintrust, LangSmith |
| Schema unit tests | Output structure drift | Datatool, custom validators |
| CI/CD eval gating | Score degradation across releases | Braintrust |
| p95/p99 latency alerts | Intermittent performance regressions | Helicone, Datadog |
My take on where AI debugging is heading
I have spent enough time watching teams add observability after their AI integrations break in production to form a strong opinion: the tools are not the problem. The sequencing is.
Most engineers reach for automated failure analysis after something goes wrong in production. That is backwards. The teams that debug effectively build trace instrumentation on day one, before they write their first agent prompt. They treat observability as a design requirement, not a firefighting tool.
I also think the shift described at Google I/O 2026 is real and happening faster than most developers realize. The role is moving from API plumbing to AI orchestration. That means debugging is no longer about HTTP status codes and response parsing alone. It is about understanding model behavior, evaluating output quality, and maintaining trust in multi-agent chains over time.
The caution I keep repeating: do not over-trust proprietary wrappers. Transparent instrumentation is what tells you whether the model that answered your request yesterday is the same one answering today. Without it, you are debugging with a blindfold on.
Build observability early. It costs almost nothing upfront and saves enormous effort later.
— Gregory
Fix malformed AI output with Datatool
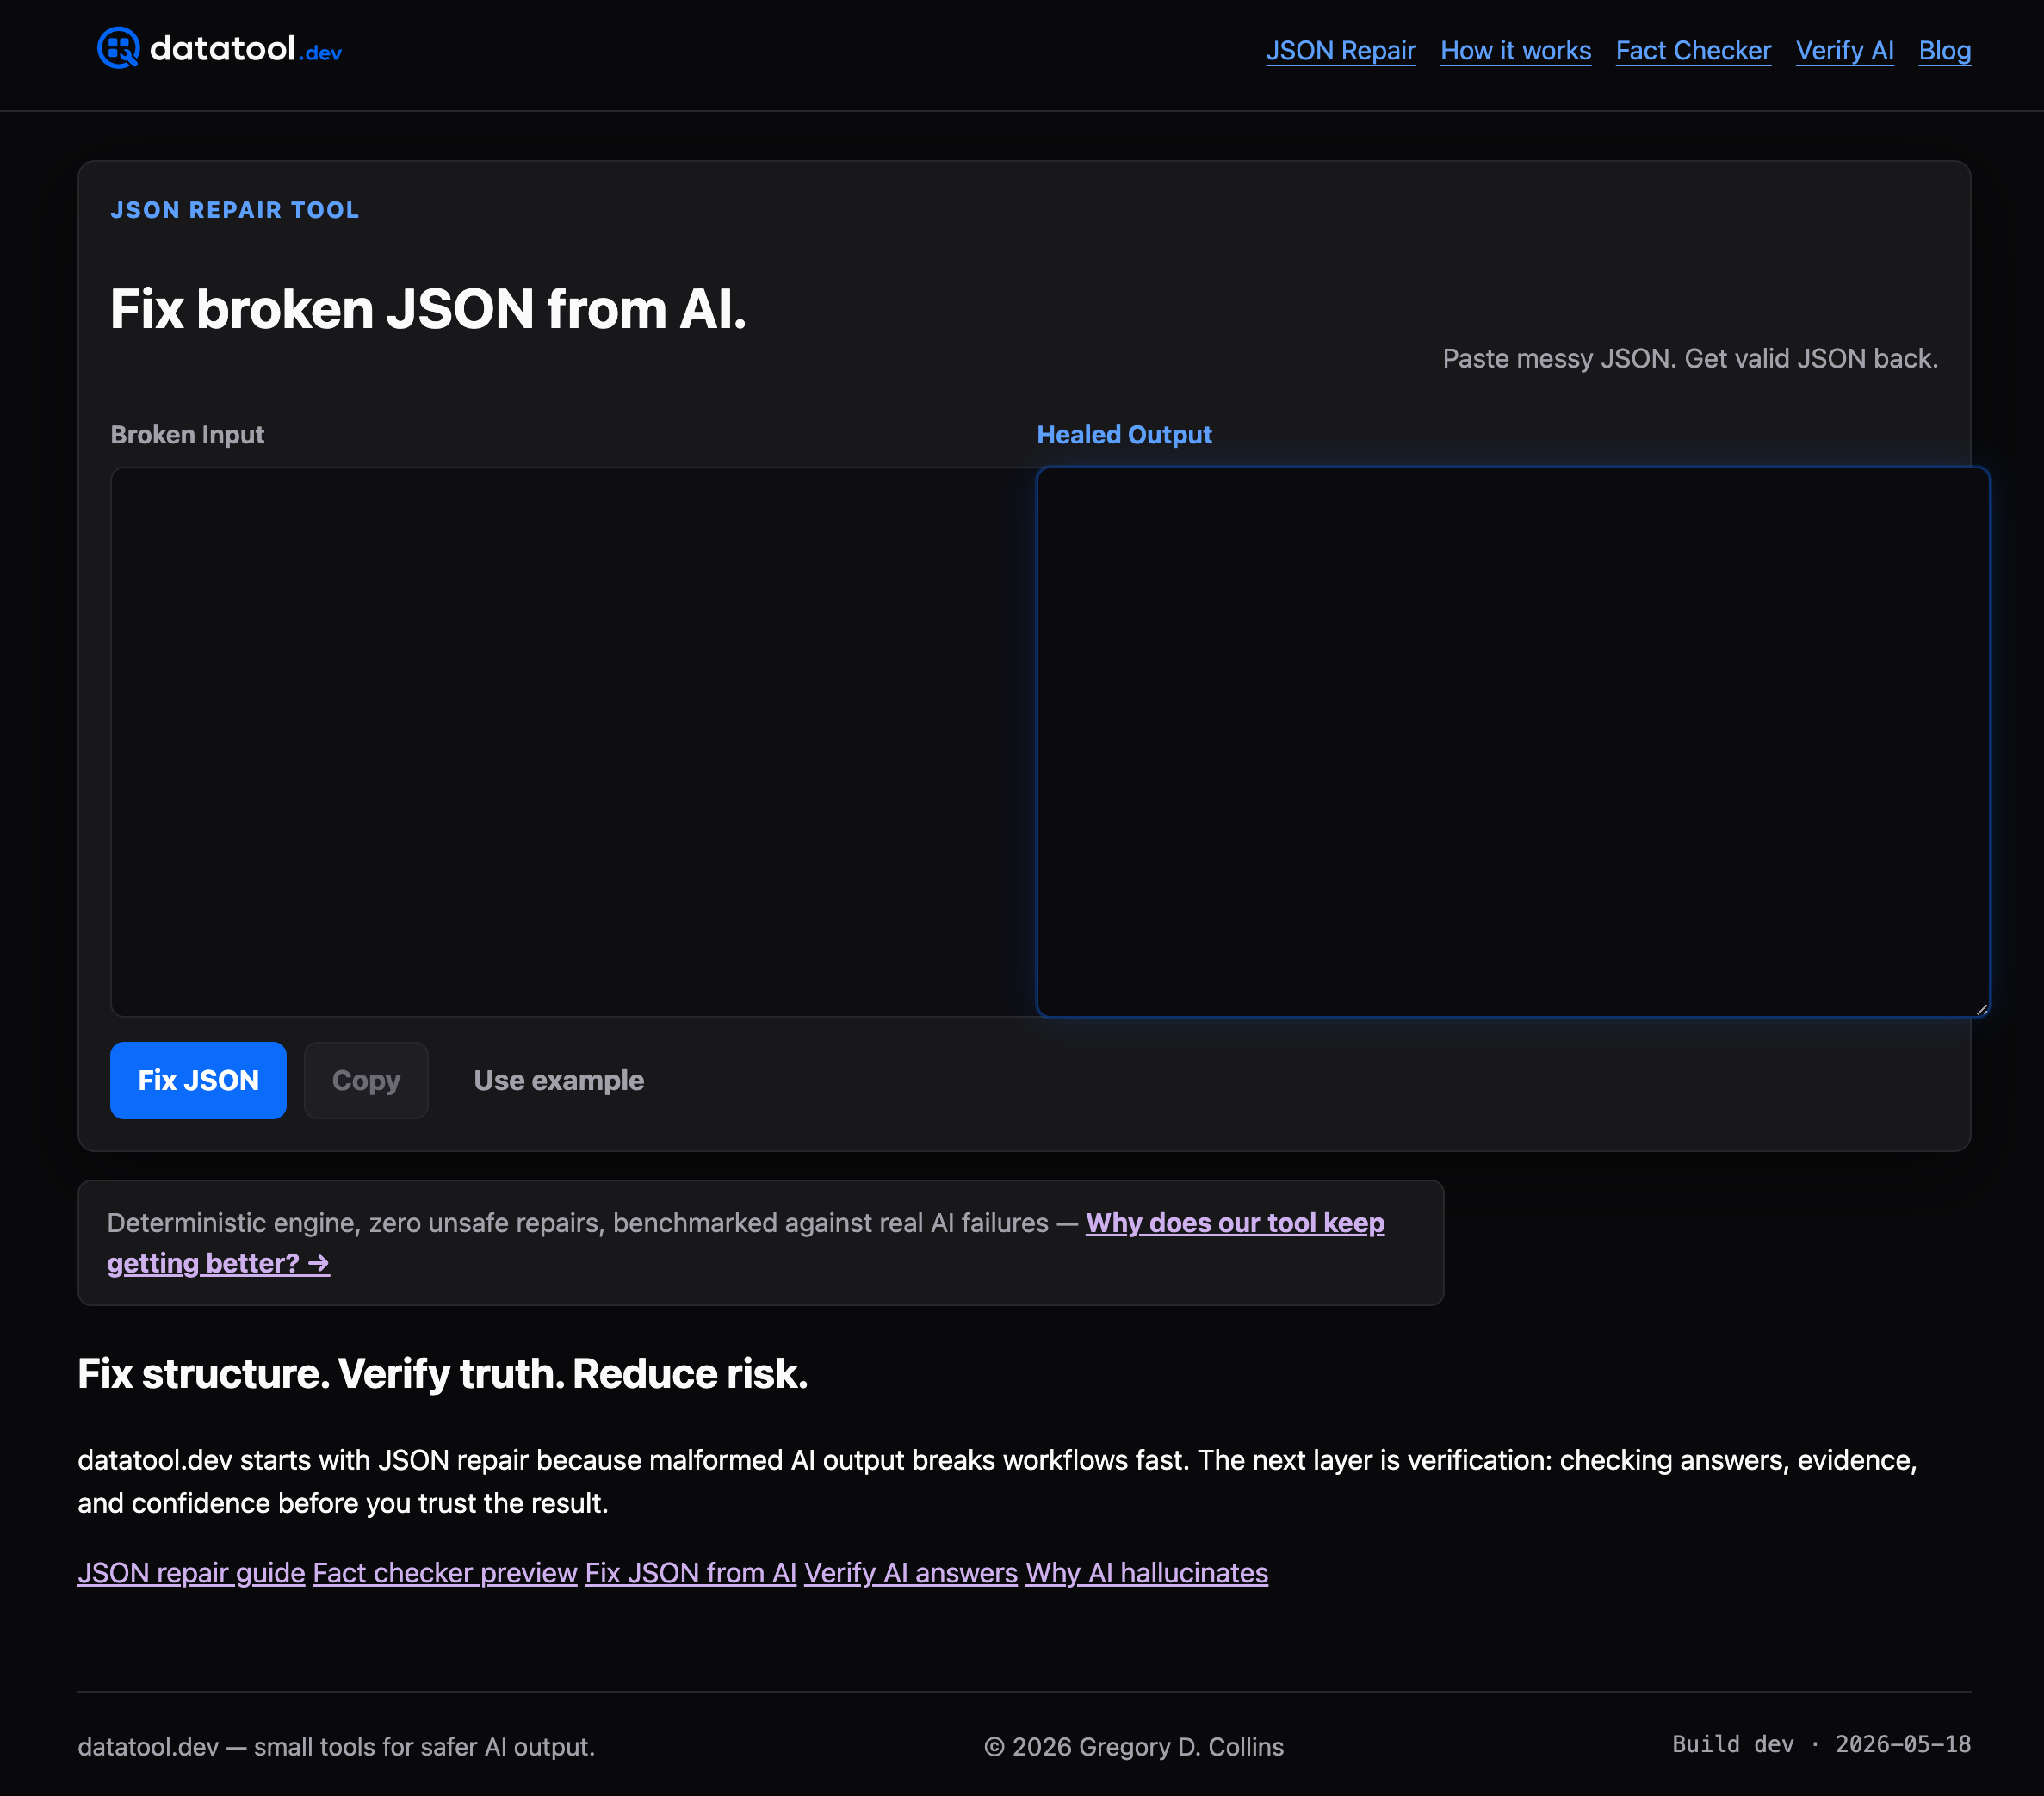
One of the most persistent failure points in AI API integrations is malformed structured output. Broken JSON, truncated objects, markdown-wrapped responses, invalid escaping. These failures are quiet and they propagate far before anyone notices. Datatool is built specifically for this problem. It repairs, validates, and tests AI-generated structured data, covering everything from partial objects to schema drift across model versions. Teams use it directly in their AI output observability workflows to catch bad output before it reaches downstream services. Paste broken JSON, get valid JSON back. Start fixing malformed API responses at datatool.dev.
FAQ
What are the best debugging tools for AI API integrations in 2026?
Braintrust, Workshop, LangSmith, Langfuse, and Helicone are the leading options. The right choice depends on your stack, whether you need local or production observability, and whether CI/CD evaluation gating is a requirement.
How do you debug silent failures in AI API workflows?
Silent failures usually result from task quota exhaustion or malformed output that parsers drop quietly. Add explicit logging of raw responses before parsing and configure failure webhooks so task drops surface immediately.
What is the fastest way to integrate debugging APIs with AI agents?
Use a proxy-based tool like Helicone for immediate request capture. It requires only a base URL change and gives you cost, latency, and session data with no code changes to your agent logic.
Why does malformed JSON cause so many problems in AI API integrations?
LLMs do not guarantee valid JSON output. Truncation, markdown wrapping, and schema drift all produce output that standard parsers reject without useful error messages. Validating the raw response before parsing prevents silent data loss.
How does automated API testing fit into AI debugging workflows?
Automated testing converts production failure traces into regression cases that run on every code change. Tools like Braintrust block merges when evaluation scores fall below threshold, making regression prevention continuous rather than manual.