
Developer productivity tooling is the set of software tools engineers use to write, test, deploy, and maintain code faster and more reliably. The category covers everything from IDEs and CI/CD pipelines to code search, observability platforms, security scanners, and AI coding assistants like GitHub Copilot. The average software team runs 15 to 25 distinct tools in their delivery pipeline. That number reflects both the complexity of modern software delivery and the risk of tool sprawl if those tools are not chosen deliberately.
What is developer productivity tooling and how is it structured?
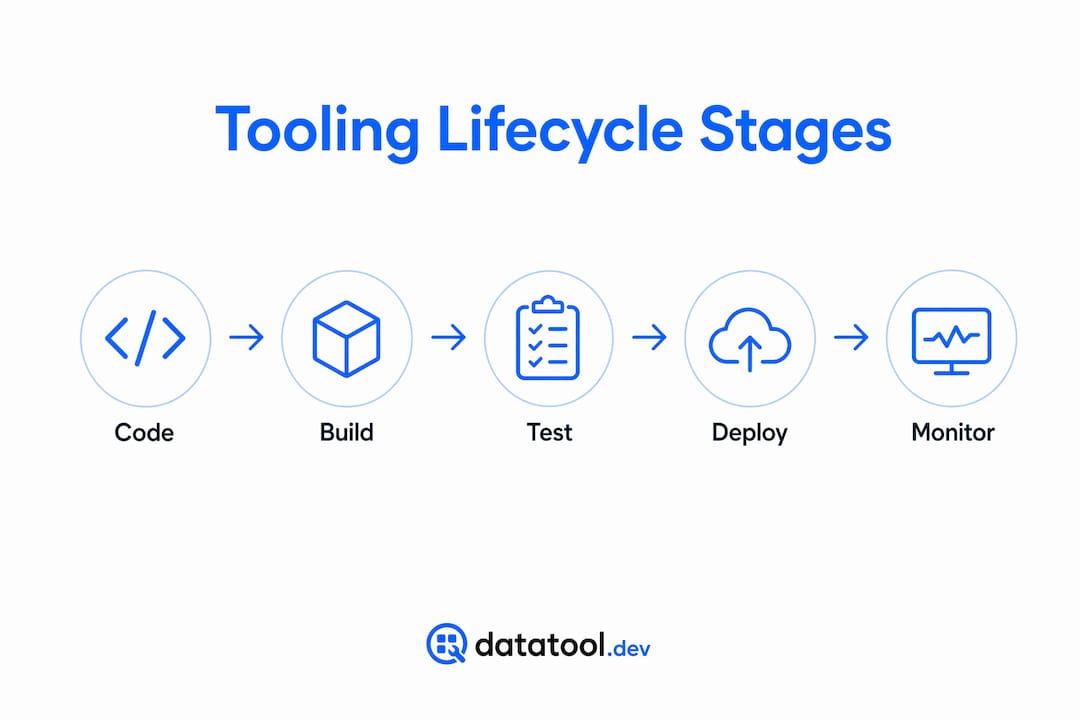
The clearest way to understand developer productivity tooling is by mapping it to the five core lifecycle stages every software team works through: Code, Build, Test, Deploy, and Monitor. Each stage has a defined set of problems, and the right tools solve those problems without creating new ones. Organizing toolchains around these five stages, with one or two best-in-class tools per stage, produces setups that are manageable and effective.
| Stage | Purpose | Example tools |
|---|---|---|
| Code | Write and review source code | VS Code, JetBrains IDEs, ESLint |
| Build | Compile, package, and resolve dependencies | Gradle, Bazel, Make |
| Test | Validate correctness at unit, integration, and E2E levels | Jest, Pytest, Playwright |
| Deploy | Ship code to environments reliably | GitHub Actions, ArgoCD, Terraform |
| Monitor | Detect failures and measure performance in production | Datadog, Grafana, OpenTelemetry |

A properly configured IDE with autocompletion, inline linting, and automatic formatting eliminates a class of bugs before they ever reach code review. That is not a minor efficiency gain. It removes an entire feedback cycle. At the Deploy and Monitor stages, fast CI/CD feedback is equally critical. Waiting 30 minutes for a test suite to complete causes developers to context-switch, and context-switching is where flow dies.
Pro Tip: Pick one tool per stage and configure it well before adding a second. Two well-configured tools outperform five loosely integrated ones every time.
How are AI-powered tools changing developer productivity in 2026?
AI coding assistants are now a standard layer in the developer productivity stack, not an experiment. Developers using GitHub Copilot complete coding tasks 55% faster on average. That is a measurable shift in throughput, not a marginal improvement.
The productivity gains come from three specific capabilities:
- Boilerplate generation. AI tools generate repetitive code structures, from API handlers to test scaffolding, in seconds. This frees engineers to focus on logic that actually requires judgment.
- Inline error detection. AI-assisted linting and code explanation surfaces issues in the editor before a build runs. The feedback loop shrinks from minutes to seconds.
- Code explanation. When a developer encounters unfamiliar code, an AI assistant can explain it in plain language. This reduces onboarding time and speeds up code review.
AI tools are also expanding into observability and security scanning. Platforms now use machine learning to surface anomalies in logs and flag dependency vulnerabilities before they reach production. For teams working with LLM-generated outputs, understanding AI output constraints becomes part of the tooling conversation, because malformed outputs from AI systems create their own class of debugging problems.
Pro Tip: Treat AI coding assistants as a junior pair programmer. Review every suggestion. The speed gain is real, but so is the risk of accepting plausible-looking code that is subtly wrong.
What best practices help you build an effective tooling stack?
Simply adopting popular tools is not enough. Teams must invest in development ergonomics and workflows to realize real productivity gains. Here is a practical framework for assembling and maintaining a toolchain that compounds in value over time.
- Cap toolchain size. Stay within the 15 to 25 tool range. Beyond that, cognitive overhead grows faster than capability.
- Standardize IDE configuration. Shared linting and formatting rules across the team eliminate style debates and reduce review noise. Commit your ".editorconfig`, ESLint, and Prettier configs to the repo.
- Automate repeatable tasks. Use CI/CD pipelines and Makefiles for builds, tests, and deployments. If a developer runs the same command more than twice a week, it belongs in automation.
- Pin dependency versions. Reproducible builds require locked versions. Use
package-lock.json,Pipfile.lock, or equivalent tools for your stack. - Shift testing left. Run unit tests on every commit. Run integration tests on every pull request. Do not wait for a staging environment to catch regressions.
- Run an annual toolchain review. Yearly toolchain audits remove unused tools and consolidate overlapping solutions. This reduces maintenance overhead and keeps the stack legible.
Here is a concrete example of a flaky test causing CI failures and how to fix it:
# BROKEN: test depends on external API call with no timeout
- name: Run integration tests
  run: pytest tests/integration/

# FIX: mock external calls and set explicit timeouts
- name: Run integration tests
  run: pytest tests/integration/ --timeout=30
  env:
    MOCK_EXTERNAL_API: "true"
The broken configuration lets a slow or unavailable external API stall the entire pipeline. The fix mocks the dependency and enforces a timeout. The test now gives a deterministic result in under 30 seconds.
"Toolchain optimization at scale requires deep ecosystem expertise to understand build graphs, dependency ordering, and caching strategies. That knowledge is gained over years, not weeks." — The Three Layers of Developer Productivity
How does developer experience tooling relate to productivity?
Developer experience, commonly called DevEx, is not just a synonym for developer productivity tooling. DevEx is a multifaceted discipline combining tools, processes, culture, and infrastructure to improve productivity and business outcomes. Tooling is the most visible layer, but it is not the only one.
The distinction matters because teams that fix only their tools while ignoring process friction or poor documentation will still see productivity stall. What is developer experience tooling, then? It is the subset of developer productivity tools focused specifically on reducing friction in the developer's daily workflow, including internal portals, documentation systems, and integrated dashboards that surface the right information at the right time.
Key metrics that connect DevEx to measurable outcomes include:
- Lead time for changes. How long from commit to production? Shorter is better.
- Cycle time. How long does a single task take from start to merge? This reveals bottlenecks in review and testing.
- Developer satisfaction scores. Surveys like SPACE or DORA capture subjective experience alongside objective metrics.
20% of development team members consider tooling quality the most significant factor in their developer experience. That figure understates the real impact, because poor tooling compounds. DevTool sprawl causes 6 to 15 hours of weekly wasted time for 75% of developers due to cognitive load and complexity. That is a full workday lost every week, per developer, to tools that do not fit together cleanly.
Key takeaways
Effective developer productivity tooling requires deliberate selection, workflow alignment, and regular maintenance rather than accumulating every popular tool on the market.
| Point | Details |
|---|---|
| Structure by workflow stage | Map tools to Code, Build, Test, Deploy, and Monitor stages for clarity and coverage. |
| AI tools deliver real speed gains | GitHub Copilot users complete tasks 55% faster; treat AI assistants as a standard toolchain layer. |
| Avoid tool sprawl | Limit your stack to 15 to 25 tools; sprawl costs developers 6 to 15 hours per week. |
| DevEx goes beyond tooling | Culture, process, and documentation affect productivity as much as the tools themselves. |
| Audit annually | Remove unused tools and consolidate overlapping ones every year to keep the stack maintainable. |
Why I think most teams get tooling wrong from the start
Most teams build their toolchain by adoption, not design. A developer joins, brings a tool they used at a previous job, and it gets added to the stack. Repeat that process for two years and you have 30 tools with three different log aggregators and two CI systems that nobody fully understands.
The teams I have seen get this right treat the toolchain as a product. They assign ownership, track usage, and cut tools that do not pull their weight. They also invest in the unsexy parts: build caching, dependency graphs, and test parallelization. These are not exciting choices, but they are the ones that compound. A 10-minute build that becomes a 2-minute build saves every developer on the team 40 minutes a day.
The other mistake is confusing tool adoption with productivity improvement. Optimizing purpose, work, knowledge, and intelligence flows reduces friction far more than adding another SaaS subscription. The best tooling investment I have seen was a team that spent three months writing internal documentation and fixing their CI pipeline. No new tools. Throughput went up 30%.
If you are working with AI-generated data in your pipeline, add validation and repair to your toolchain early. Malformed JSON from LLMs is a real failure mode, and it will block your pipeline at the worst possible time. Check out AI output testing practices before you hit that wall in production.
— Gregory
Fix AI output failures before they break your pipeline
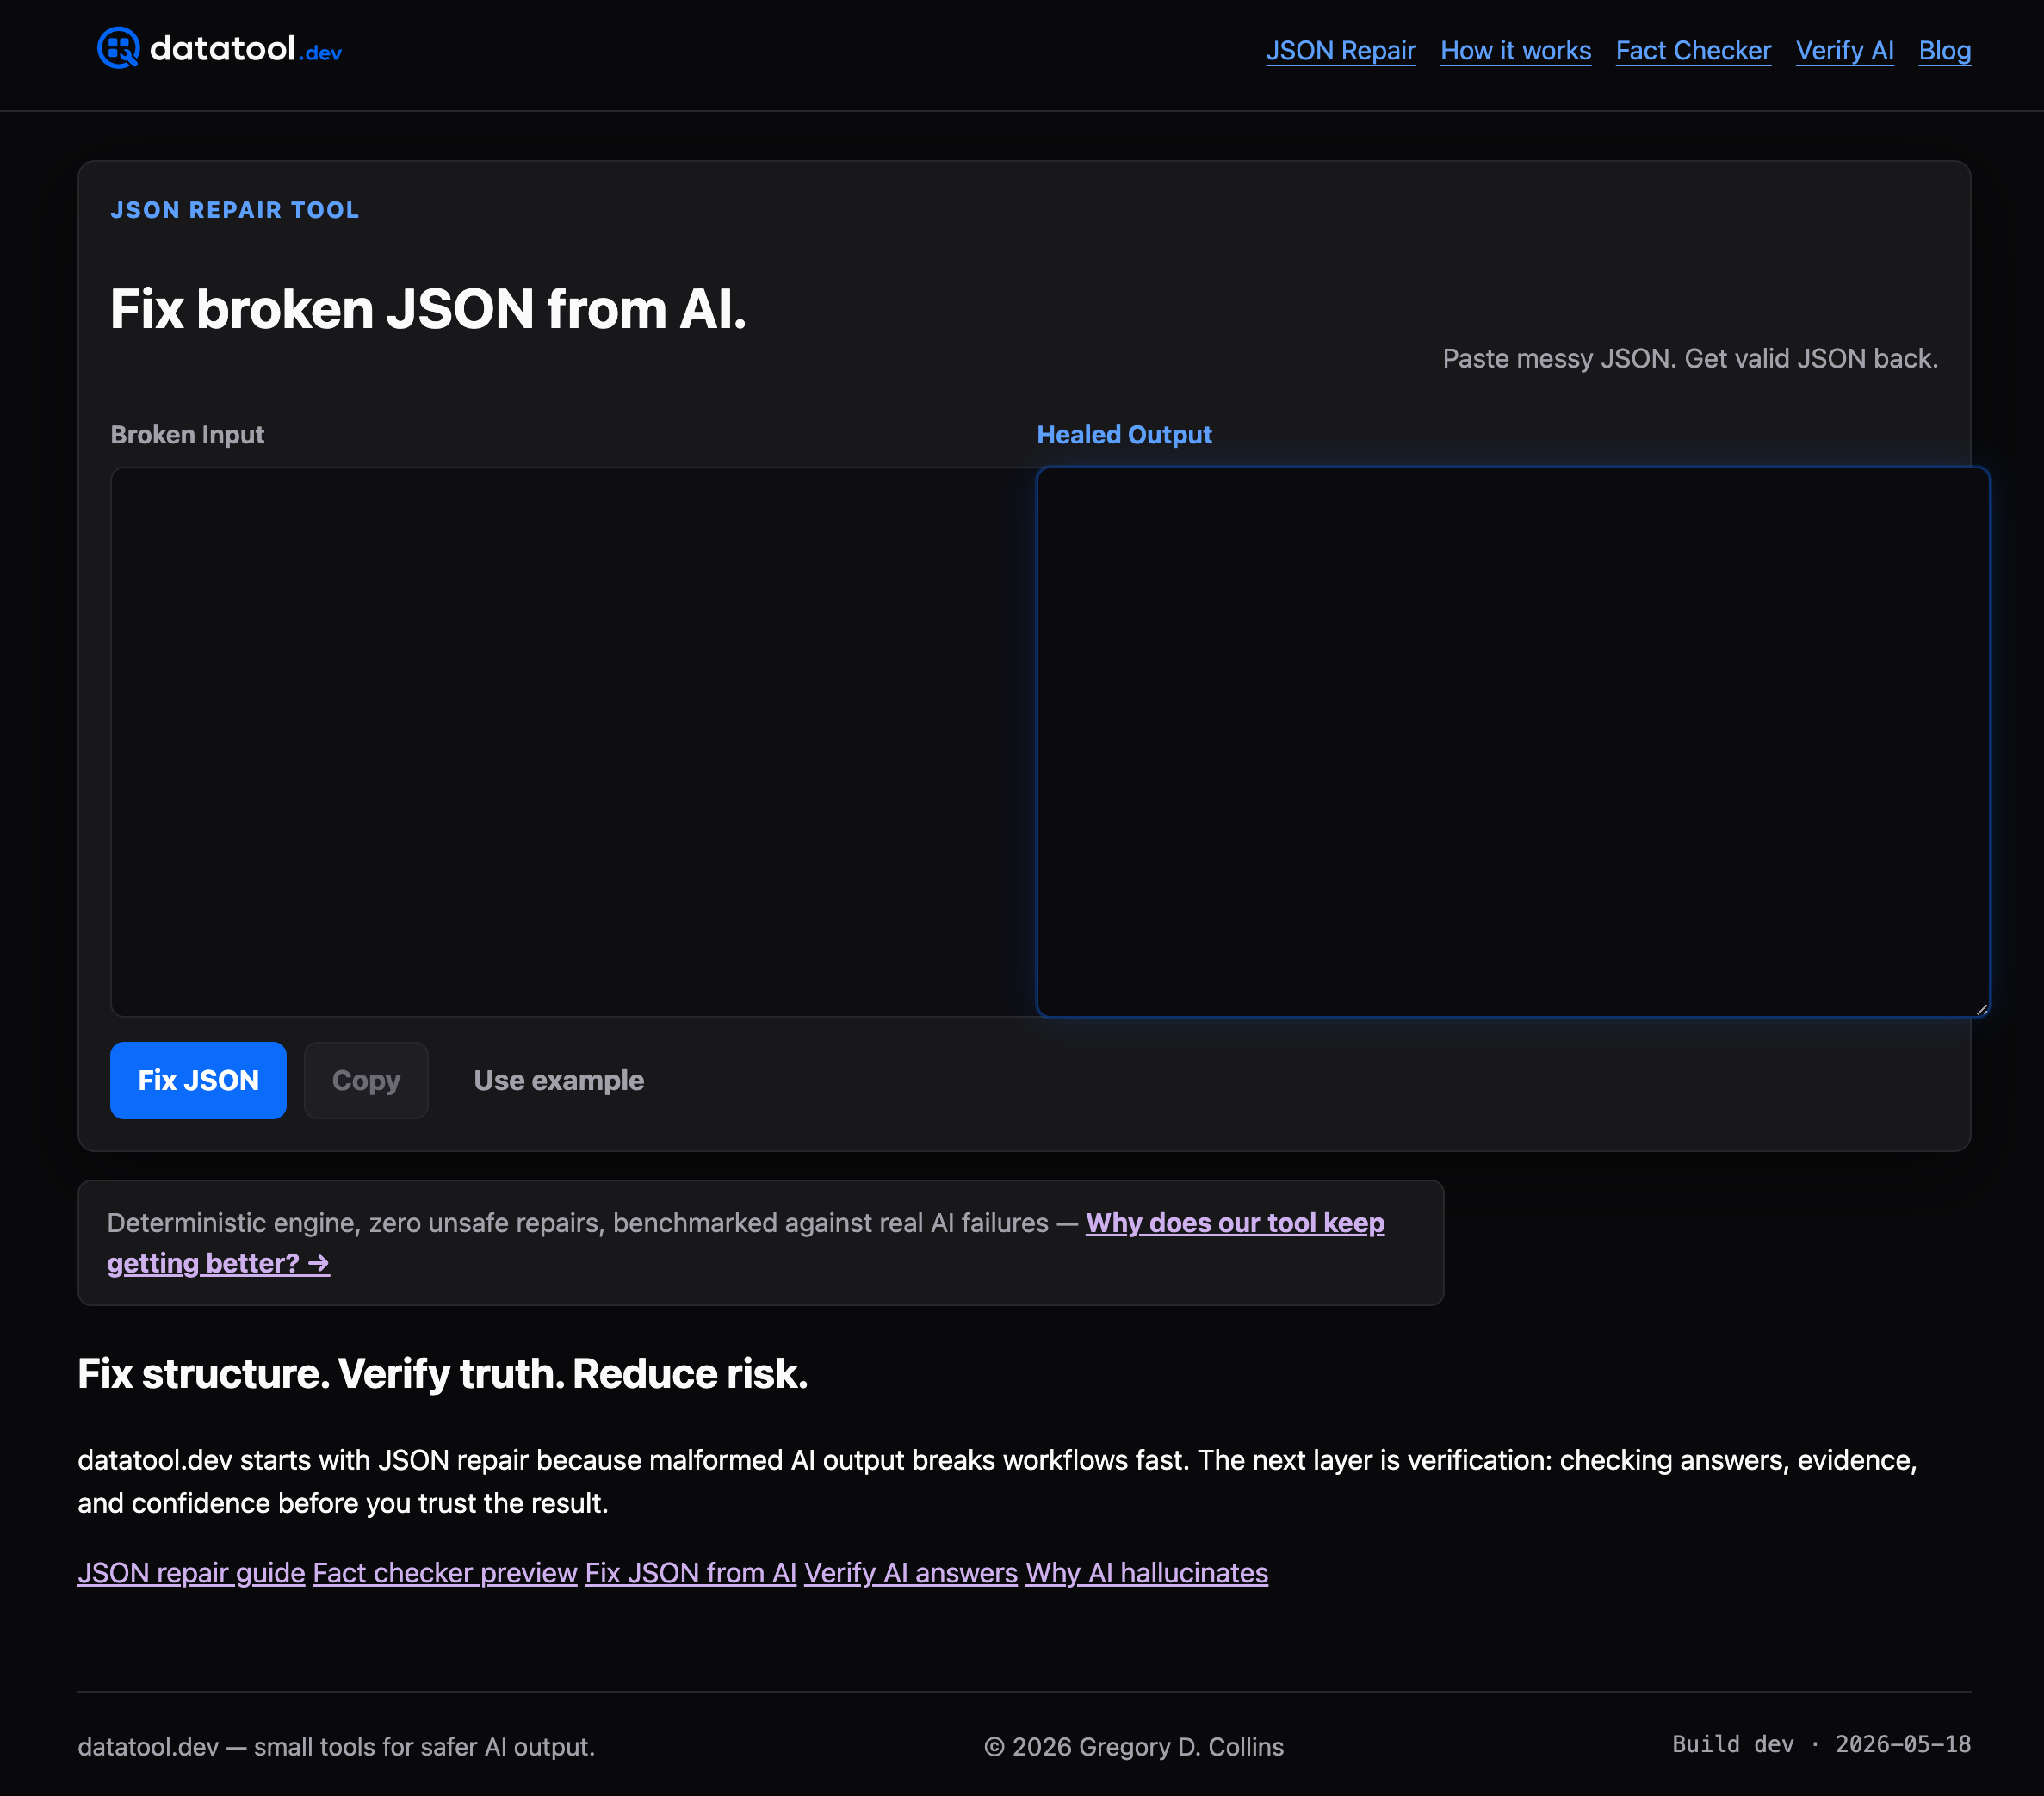
If your toolchain includes LLM-generated structured data, broken JSON is not a hypothetical. It is a production incident waiting to happen. Datatool is built specifically for this problem. It repairs malformed AI output including broken JSON, partial objects, invalid escaping, truncation, and schema drift. Paste broken output. Get valid, verified data back. No manual parsing. No fragile regex workarounds. Datatool integrates directly into your debugging workflow so you can fix broken JSON from AI without stopping your pipeline. Built for developers who need reliable structured data from LLMs, not just fast output.
FAQ
What is developer productivity tooling?
Developer productivity tooling is the collection of software tools that help engineers write, test, deploy, and maintain code faster. It covers IDEs, CI/CD pipelines, code review tools, observability platforms, and AI coding assistants.
How many tools does the average dev team use?
The average software team uses 15 to 25 distinct tools in their delivery pipeline. Exceeding that range typically introduces cognitive overhead that reduces rather than increases productivity.
What is the difference between DevEx and developer productivity tooling?
Developer productivity tooling refers to specific software tools. Developer experience (DevEx) is broader, encompassing tools, processes, culture, and infrastructure. Tooling is one component of DevEx, not a synonym for it.
How much faster do AI coding assistants make developers?
Developers using GitHub Copilot complete coding tasks 55% faster on average. The gains come from boilerplate generation, inline error detection, and code explanation capabilities built into the assistant.
How often should teams review their toolchain?
Annual toolchain reviews are the recommended minimum. These audits remove unused tools, consolidate overlapping solutions, and reduce the maintenance overhead that accumulates as teams grow and projects evolve.