

Monitoring AI data quality in production is not a solved problem. Your model passed every offline eval, shipped cleanly, and then quietly started returning malformed JSON, semantically wrong answers, or truncated objects two weeks later. Post-deployment monitoring is critical precisely because AI systems face non-deterministic outputs, dynamic inputs, and real-world conditions that no test suite fully anticipates. This guide gives you a concrete, layered approach to setting up monitoring that actually catches problems before users do.
Table of Contents
- Key takeaways
- Monitoring AI data quality in production: prerequisites and tools
- Step-by-step monitoring implementation
- Drift detection and long-term data integrity
- Common monitoring challenges and how to fix them
- My take on what actually works in production
- Fix AI data quality issues with Datatool
- FAQ
Key takeaways
| Point | Details |
|---|---|
| Layer your quality checks | Run fast structural validation first, then slower semantic scoring to balance speed and coverage. |
| Carry scorers from dev to prod | Reuse the same scorer code in production that you used during development to prevent metric drift. |
| Build rolling baselines | Use the first two weeks of production traffic to establish baselines before setting drift alert thresholds. |
| Separate pipeline from model failures | Monitor ingestion health independently from output quality to diagnose root cause accurately. |
| Define enforcement, not just logging | Specify what happens when a quality violation fires: reroute, fallback, or human review. |
Monitoring AI data quality in production: prerequisites and tools
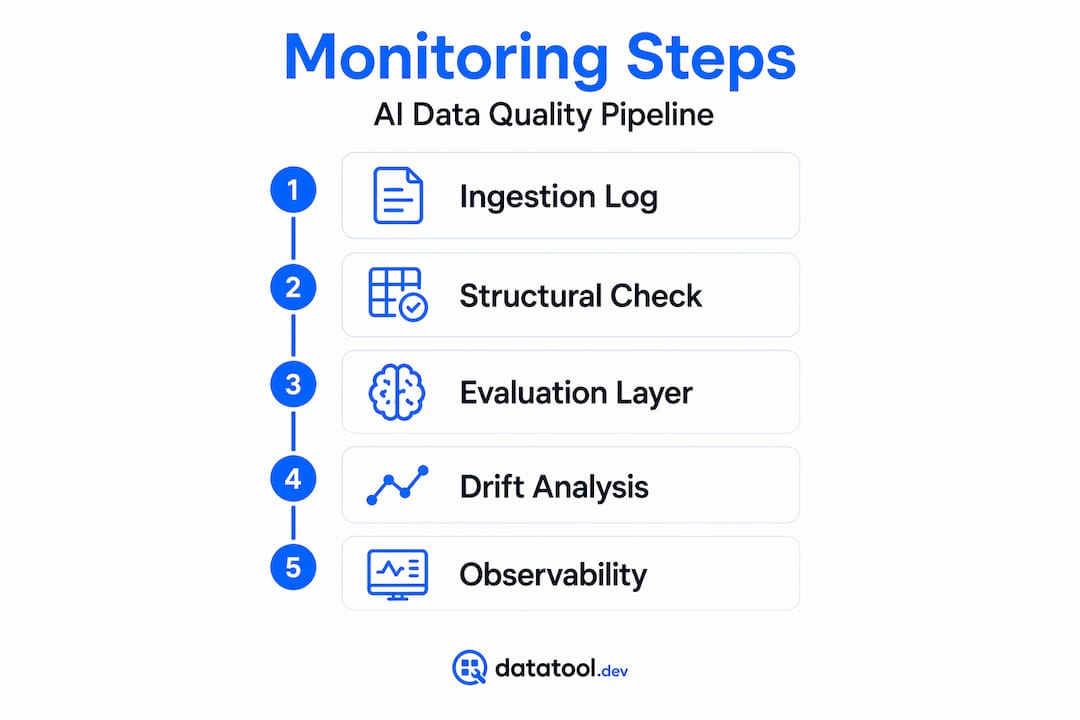
Before you write a single scorer, you need to know what is flowing through your pipeline. Ingestion event logs in Databricks LakeFlow track row and byte counts per table, along with "flow_progressandoperation_progress` metrics. These tell you whether data is arriving correctly before it ever reaches your model. A stalled ingestion looks identical to a bad model output from the outside. You need to rule it out first.
Once the pipeline health layer is covered, you need evaluation infrastructure. The table below summarizes the core components.
| Component | Purpose | Example |
|---|---|---|
| Ingestion monitoring | Detect stalled or partial data loads | LakeFlow event logs |
| Code-based scorers | Measure output quality with deterministic functions | @scorer-decorated Python functions |
| LLM judges | Semantic evaluation via prompted models | MLflow LLM-as-judge |
| Alert mechanisms | Notify on threshold breaches | Databricks alerts, PagerDuty |
| Secret management | Secure external API calls from scorer logic | Databricks secrets API |
Scorers in MLflow must be @scorer-decorated functions. Class-based scorers are not supported in production monitoring. Get this right before you build anything else, because refactoring scorer architecture mid-deployment is painful.
For an overview of how observability fits into this infrastructure, the AI output observability guide from Datatool covers the foundation clearly.
Step-by-step monitoring implementation
Effective monitoring requires two distinct layers working in sequence. Layered quality checks combine fast deterministic schema validation with slower semantic evaluation backed by enforcement policies.
Layer 1: structural validation. This runs synchronously, pre-emission. Check that the output matches your expected schema, that required fields are present, that types are correct, and that JSON is parseable. This is your cheapest, fastest gate.
Here is what a real failure looks like and how detection works in the monitoring pipeline:
# Raw LLM output — truncated, unparseable
raw_output = '{"product": "Widget A", "price": 9.99, "tags": ["sale"'

import json

def validate_structure(output: str) -> dict:
    try:
        parsed = json.loads(output)
        required_keys = {"product", "price", "tags"}
        missing = required_keys - parsed.keys()
        if missing:
            return {"valid": False, "reason": f"Missing keys: {missing}"}
        return {"valid": True, "parsed": parsed}
    except json.JSONDecodeError as e:
        return {"valid": False, "reason": f"JSON parse error: {str(e)}"}

result = validate_structure(raw_output)
# Output: {"valid": False, "reason": "JSON parse error: Expecting ',' delimiter: line 1 column 47 (char 46)"}
That failure gets logged, the enforcement policy fires, and the request routes to a fallback. No user sees the broken response.
Layer 2: semantic scoring. Code-based scorers receive the full trace object including inputs, outputs, and expectations. Use them for relevance scoring, factual grounding checks, and embedding-based similarity against reference outputs. These run asynchronously to avoid latency penalties.
Here are the numbered implementation steps from start to finish:
- Instrument your AI calls with structured trace logging. Capture input, output, latency, and model version on every request.
- Register
@scorer-decorated functions in MLflow. Write these in the same notebook used for dev evaluation. - Define your enforcement contract: what action fires on each violation type. Re-ask, fallback, or human queue.
- Connect ingestion monitoring to a separate alert channel from output quality alerts.
- Set up your alerting thresholds before you go live. Tune them in week two once baseline data exists.
- Run a dry-fire test by injecting known bad outputs through the scorer pipeline and verifying alerts trigger correctly.
Pro Tip: Reuse evaluation code from development directly in your production scorer registration. Do not rewrite it. Any divergence between dev and prod scorer logic is a source of metric drift you will spend weeks chasing.
For practical detection patterns at the code level, the Datatool guide on detecting malformed AI output covers edge cases including partial objects and truncation.
Drift detection and long-term data integrity
Drift in AI systems is rarely dramatic. It is usually a 3% relevance score drop over eight days. You miss it until users complain. Effective drift monitoring requires building a rolling baseline from your first two weeks of production traffic, then sampling 5 to 10% of live outputs daily, and alerting when scores drop more than 5% over a seven-day rolling window.

The seven-day window matters. Daily variance is noisy. A single-day threshold generates false positives constantly and causes alert fatigue faster than almost anything else in a monitoring stack.
For retrieval-augmented generation systems, separate retrieval quality from generation quality. A drop in answer relevance might mean your retriever is returning stale chunks, not that your generator is degrading. Conflating the two metrics makes root cause analysis nearly impossible.
Pro Tip: Build your rolling baseline metric trends before you set any alert thresholds. Alert thresholds defined before baseline data exists are almost always wrong and will either miss real issues or create noise from day one.
Common pitfalls in drift detection:
- Alerting on absolute scores instead of relative trend changes
- Using the same alert threshold for high-stakes and low-stakes outputs
- Forgetting to version your scorer when you update it, which breaks baseline comparisons
- Monitoring only final outputs and missing retrieval degradation in RAG pipelines
- Ignoring input distribution shift as a leading indicator of future output quality drops
Rolling baseline approaches reduce false alarms significantly while catching subtle degradations that static thresholds miss entirely.
Common monitoring challenges and how to fix them
The most expensive mistake in AI data quality monitoring is misattributing a pipeline failure to a model failure. Ingestion and output monitoring must be separated into distinct alert channels. When your semantic scores drop, the first question is always whether data arrived correctly.
The table below compares the two main failure domains and how to handle them.
| Issue type | Symptom | Correct response |
|---|---|---|
| Pipeline failure | Stalled ingestion, missing rows | Check flow_progress logs, not model outputs |
| Model output failure | Schema violations, low scorer results | Review trace logs, trigger enforcement policy |
| Scorer logic error | Monitoring gaps, missing metrics | Wrap scorer in try/except, log exceptions, return null score |
| Metric drift in monitoring | Dev vs prod score divergence | Reuse dev scorer code verbatim in production |
Error-resilient scorer functions must include graceful fallback. If a scorer throws an exception, your monitoring system should log the failure and return a null score rather than crashing the evaluation pipeline. A silent scorer gap is harder to detect than a bad score.
NIST's 2026 findings highlight that reducing monitoring noise by combining automated checks with periodic manual review is one of the most underdeveloped practices in production AI systems. Schedule a weekly human review of sampled outputs even when automated alerts are quiet.
The Datatool resource on AI output error detection covers structural failure patterns worth adding to your Layer 1 checklist.
My take on what actually works in production
I have watched teams build monitoring dashboards that looked great and caught nothing. The root cause is almost always the same: they logged metrics without defining what to do when those metrics fail. A monitoring-to-enforcement contract is not optional. If you cannot answer "what happens when this scorer fires?", your monitoring is decoration.
The second thing I have learned is that scorer consistency between dev and production is more important than scorer sophistication. A simple, consistent scorer you trust beats an elaborate one that diverges from your dev evals.
On synchronous versus asynchronous monitoring: run structural checks synchronously every time. Run semantic scoring asynchronously unless your use case is genuinely high-risk, like medical or financial outputs. The latency cost of synchronous LLM judges is real and will create pressure to disable monitoring entirely. Do not let that happen.
Finally, do not skip the weekly human review. Automated systems develop blind spots. A 30-minute human sample review every week catches the class of failures your scorers were never designed to detect.
— Gregory
Fix AI data quality issues with Datatool
When your monitoring pipeline flags malformed output, you need a repair layer that works fast. Datatool is built specifically for this problem. It repairs broken JSON from LLMs including truncated objects, invalid escaping, schema drift, and wrapped responses.
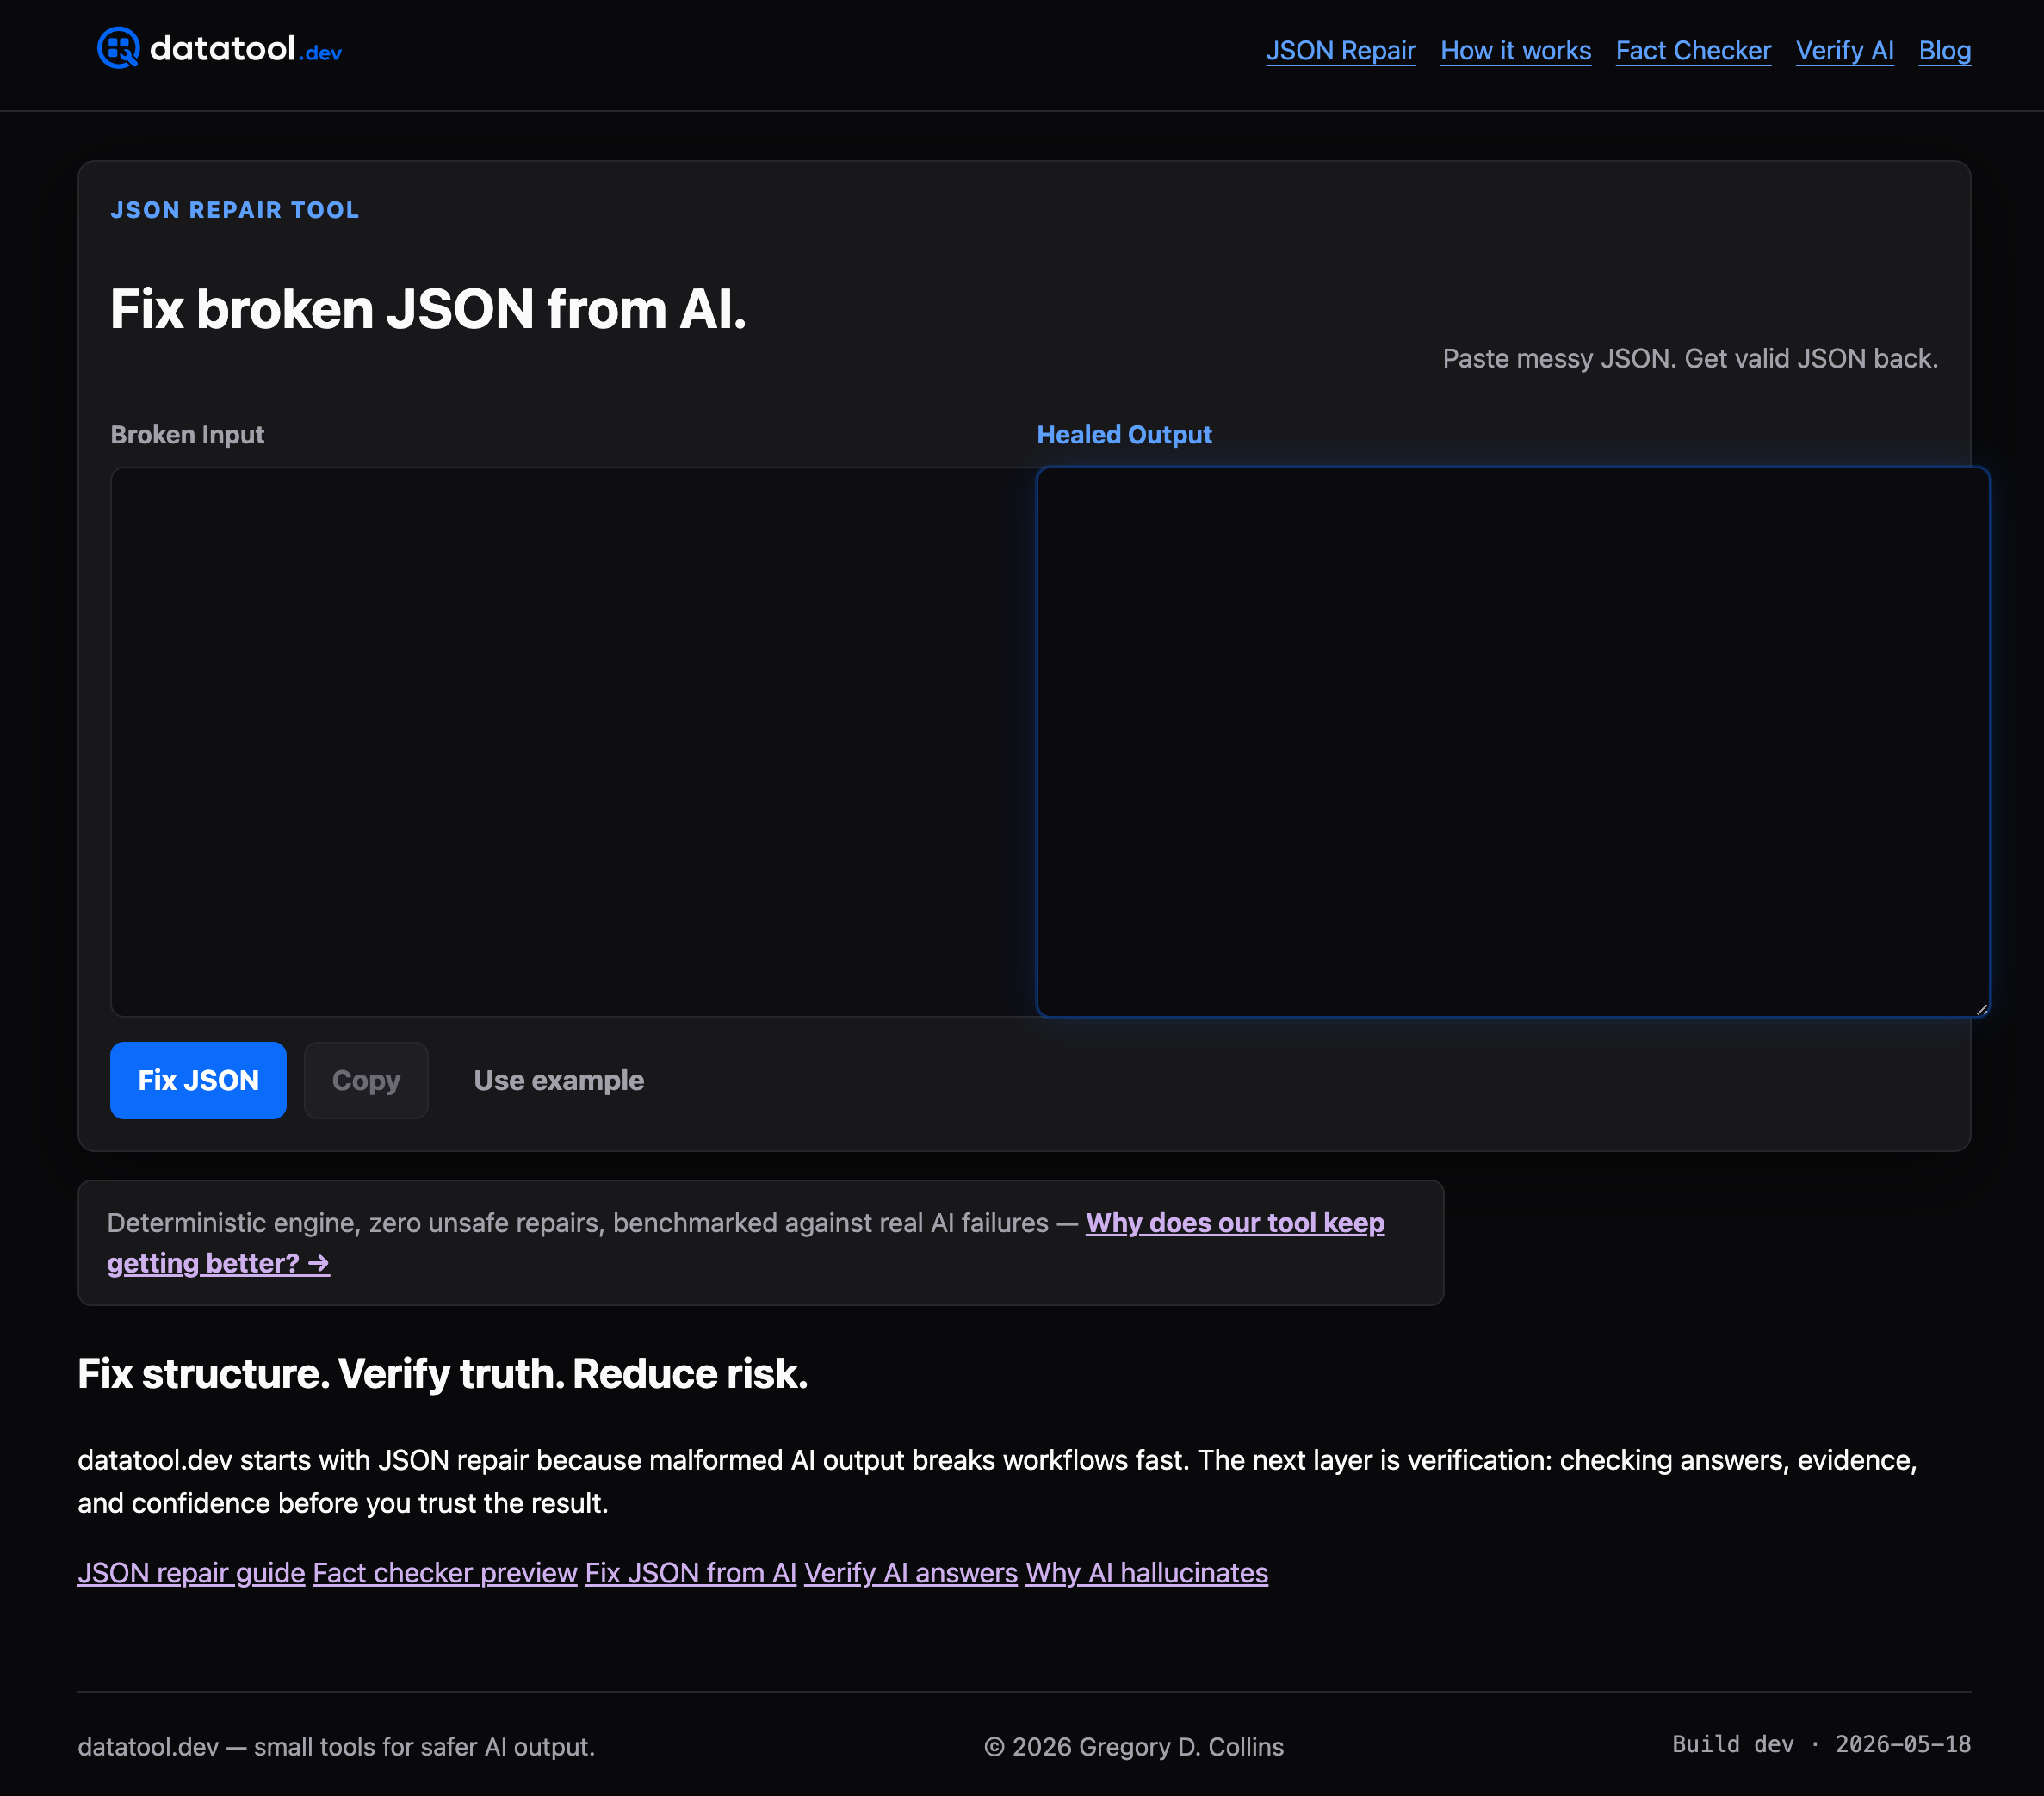
Datatool integrates directly with your existing production quality checks. You flag the bad output in your monitoring system, pass it through Datatool's repair layer, and get valid structured data back. No manual intervention needed. Start fixing malformed AI output at datatool.dev and pair it with the monitoring practices covered in this guide.
FAQ
What is the first step in monitoring AI data quality in production?
Start by separating ingestion pipeline monitoring from model output quality monitoring. Confirm data is arriving correctly before evaluating what the model produces.
How often should I sample live AI outputs for quality checks?
Sample 5 to 10% of outputs daily. Build a rolling baseline from your first two weeks of traffic before setting any alert thresholds.
How do I prevent metric drift between development and production?
Reuse the exact same @scorer-decorated functions from your development evaluation in production registration. Any rewrite of scorer logic breaks metric comparability.
What should happen when a quality violation fires?
Define an enforcement policy before deployment. Options include re-asking the model, routing to a fallback response, or queuing the output for human review. Logging alone is not enough.
How do I monitor data quality in RAG systems specifically?
Track retrieval quality and generation quality as separate metrics. A drop in answer relevance may indicate stale retrieval chunks rather than model degradation.