
AI output benchmarking is the process of systematically evaluating AI-generated results against standardized, task-specific datasets and scoring metrics to objectively compare model output quality and performance. The industry term for this practice is AI model evaluation, and the two terms are used interchangeably throughout applied machine learning. Benchmarks measure seven key dimensions including quality, latency, safety, cost efficiency, and user satisfaction. Without a structured evaluation framework, you cannot tell whether a model change made things better, worse, or simply different.
What is AI output benchmarking, and why does it matter?
AI output benchmarking gives you a repeatable, objective way to measure what your model actually produces. It replaces gut-feel assessments with scored comparisons across fixed datasets. The goal is not to find the "best" model in the abstract. The goal is to find the model or configuration that performs best on your specific task.
Public benchmarks often miss critical dimensions like cost efficiency and safety that matter in production. A model that scores well on a general reasoning leaderboard may still fail on your invoice extraction pipeline. That gap between benchmark score and real-world behavior is exactly why structured evaluation exists.
What key metrics are measured in AI output benchmarking?
A single accuracy score tells you almost nothing useful. A 7-dimension scorecard captures the full picture of AI risk and value. The dimensions that matter most in production are:
- Output quality: Accuracy, precision, recall, and F1 score against labeled ground truth
- Latency percentiles: P50, P95, and P99 response times. P95 and P99 reveal the worst-case behavior that averages hide.
- Safety and reliability: Rate of harmful outputs, refusals, and schema violations
- Cost efficiency: Tokens consumed or dollar cost per successful outcome
- User satisfaction: Human preference ratings or task completion rates
- Scalability: Performance under concurrent load
- Regression rate: How often a new model version breaks previously passing cases
Each dimension interacts with the others. A model with low latency but high cost per token may be worse for your use case than a slower, cheaper one. Benchmarking multiple interdependent variables is the only way to see those trade-offs clearly.
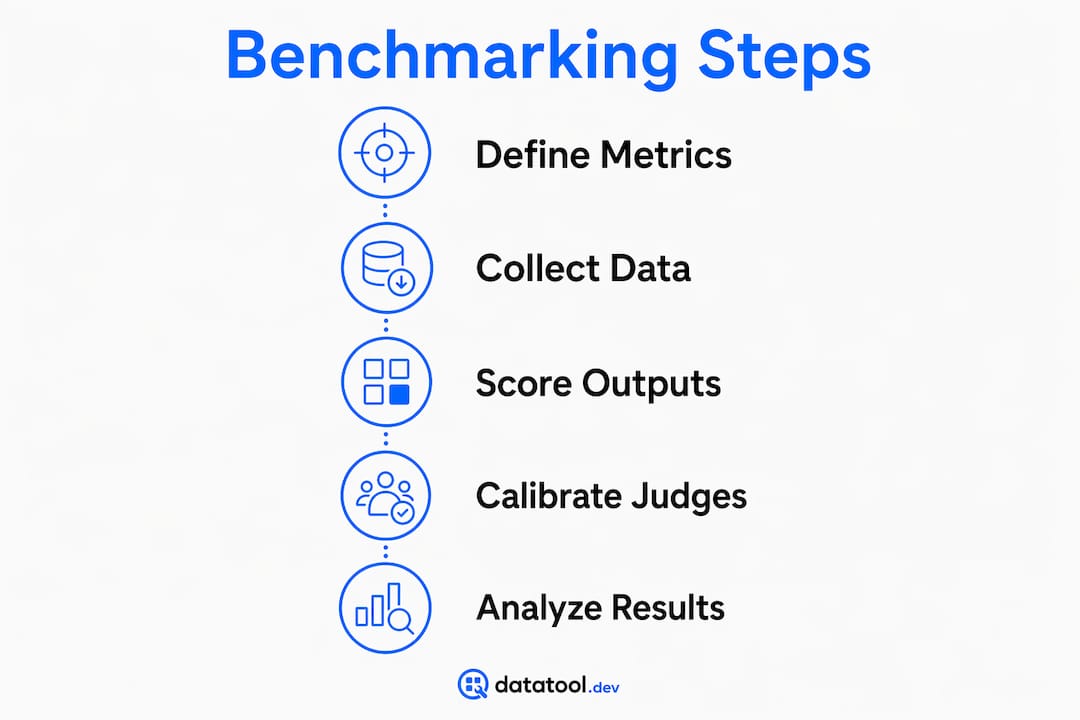
How are AI benchmarks created and scored?

Building a benchmark starts with a representative dataset. Effective benchmarks use 100–500 real-world queries paired with clear rubrics and require a minimum of 30 samples per configuration for statistical significance. Fewer than 30 samples and your results are noise, not signal.
The scoring methods available to you fall into four categories:
- Exact match: The output must equal the expected string. Fast and unambiguous, but brittle for natural language tasks.
- Embedding similarity: Measures semantic closeness between the model output and a reference answer. Works well for paraphrase-tolerant tasks.
- LLM-as-a-judge: A second language model scores the output against a rubric. Pairwise comparison reduces cognitive load compared to absolute scoring and is the preferred method for subjective quality assessment.
- Human evaluation: The gold standard for nuanced tasks, but expensive and slow.
Pro Tip: Calibrate any automated judge against a golden human-labeled set of 30–50 examples before trusting its scores. LLM-as-a-judge evaluations require calibration to mitigate positional and verbosity bias. Without it, the judge's errors compound silently.
Metrics like Pass@k for code generation and Elo ratings for human preference ranking are standard in the field. Pick the scoring method that matches your task type, not the one that is easiest to implement.
Why do public benchmarks fall short for production systems?
Public benchmarks suffer from two structural problems: saturation and data leakage. Models are trained on data that overlaps with popular benchmarks, so high scores reflect memorization as much as capability. High public benchmark scores often do not predict success in production environments.
The fix is a custom benchmark built from your actual failure cases. Custom benchmarks use 50–200 real inputs drawn from production logs where the model broke, hallucinated, or returned malformed output. This approach encodes correctness for your specific application, not for a generic academic task.
Custom benchmarks also catch silent regressions. A model update that improves average accuracy by 2% can simultaneously break a specific edge case that your users hit daily. A benchmark built from real deployment failure modes will catch that regression before it ships.
Pro Tip: Start your custom benchmark with the 20 worst failures from your production logs. Those cases encode more signal about your system's real weaknesses than any public dataset.
| Evaluation type | Strengths | Weaknesses |
|---|---|---|
| Public benchmarks | Fast to run, easy to compare across models | Saturated, leakage risk, misses domain specifics |
| Custom benchmarks | Task-specific, catches real regressions | Requires production data and labeling effort |
How to integrate AI output benchmarking into production workflows
Benchmarking is not a one-time activity. Continuous integration pipelines benefit from embedded benchmarking checks that gate deployments and prevent silent regression. Treat your benchmark suite the same way you treat unit tests: run it on every model or prompt change before merging.
The practical steps for embedding evaluation in your workflow are:
- Log structured inputs and outputs from every production request. You cannot benchmark what you have not captured.
- Run automated checks on each deployment candidate against your custom benchmark suite.
- Gate releases on benchmark pass rates. If a new prompt drops your JSON schema compliance rate below threshold, block the deploy.
- Monitor P95 and P99 latency in real time, not just average response time. Spikes at the tail percentile signal infrastructure or model issues before users complain.
- Track cost per successful outcome across model versions. A cheaper model is only better if quality holds.
Pro Tip: Log the full structured output, not just the final answer. Malformed JSON, truncated objects, and schema drift are AI output reliability issues that only show up when you inspect the raw response.
What are the common pitfalls in AI output benchmarking?
The most common mistake is reporting a single average score and calling it done. Distributional metrics like P95 and P99 latency reveal critical failure modes that mean accuracy hides. A model with 95% average accuracy and a 20% failure rate on a specific input class is not a 95% accurate model for users who send that input class.
A second pitfall is trusting an uncalibrated LLM judge. Without a golden calibration set, automated judges produce silent errors that mislead stakeholders. The judge may consistently favor longer outputs regardless of quality, a known verbosity bias.
A third pitfall is ignoring cost in the success metric. Cost-normalized success metrics that combine quality and resource usage give a realistic picture of model value. A formula like Success Rate divided by log(1 + Cost Ratio) captures the trade-off between accuracy and computation cost in a single number.
"The benchmark you trust is the one you built from your own failures, calibrated against your own ground truth, and run on every deploy."
Datatool testing confirms a fourth pitfall: structured output failures are often invisible to quality metrics. A model that returns broken JSON scores zero on downstream tasks, but the benchmark only records a failed parse, not the root cause. Tracking AI output confidence scoring alongside pass rates gives you the signal to fix the right thing.
Key Takeaways
Effective AI output benchmarking requires custom datasets built from real failure cases, multi-dimensional scoring, and continuous integration into deployment pipelines to catch regressions before they reach production.
| Point | Details |
|---|---|
| Define dimensions upfront | Measure quality, latency, cost, and safety together, not accuracy alone. |
| Use 30+ samples per config | Fewer samples produce statistically unreliable results that mislead decisions. |
| Build custom benchmarks | Use 50–200 real production failures to encode task-specific correctness. |
| Gate deploys on benchmark results | Block releases that drop below threshold on any critical metric. |
| Calibrate automated judges | Validate LLM-as-a-judge against 30–50 human-labeled examples before trusting scores. |
The leaderboard trap is real
I have watched teams spend weeks chasing a 2-point improvement on a public leaderboard, then ship a model that broke their JSON extraction pipeline on day one. The leaderboard score was real. The production failure was also real. The two facts coexisted because the benchmark measured something different from what the system actually needed to do.
The teams that get benchmarking right start from the opposite direction. They pull their worst production failures, label them, and build a dataset that encodes exactly what "correct" means for their application. That dataset becomes the gating criterion for every model and prompt change. When a new version ships, the first question is not "did the leaderboard score go up?" It is "did it pass the regression suite?"
I also see practitioners underestimate structured output failures. A model that hallucinates a field name or truncates a JSON object will fail silently if your benchmark only checks semantic quality. You need to validate the raw output format, not just the extracted value. That is a gap most evaluation setups miss entirely.
My recommendation for anyone starting a benchmarking initiative: pick five real failure modes from production, build 10 labeled examples for each, and run that 50-case suite on every change. It is not comprehensive. It is enough to catch the regressions that actually hurt you.
— Gregory
Datatool and AI output validation in production
Benchmarking tells you when your model is failing. Datatool tells you exactly what the output looks like when it does.
Datatool is built for the malformed AI outputs that benchmarks flag but do not fix: broken JSON, truncated objects, invalid escaping, and schema drift from LLMs. When your benchmark suite catches a structured output regression, Datatool gives you the repair and validation layer to fix broken AI output before it propagates downstream. It integrates directly into the same CI/CD workflows where your benchmarks run, so detection and correction happen in the same pipeline. Paste malformed output. Get valid, schema-compliant JSON back.
FAQ
What is AI output benchmarking in simple terms?
AI output benchmarking is a structured process for measuring how well an AI model performs on a specific task using fixed datasets and scoring rules. It produces objective, repeatable results that you can compare across model versions.
How many samples do I need for a valid AI benchmark?
A minimum of 30 samples per configuration is required for statistical significance. Effective real-world benchmarks use 100–500 representative queries for general evaluation and 50–200 inputs for custom regression suites.
Why do public AI benchmark scores not match production performance?
Public benchmarks suffer from data leakage and task mismatch. Models trained on overlapping data score high without generalizing, and academic tasks rarely reflect the specific inputs and constraints of a production system.
What is LLM-as-a-judge, and when should I use it?
LLM-as-a-judge uses a second language model to score outputs against a rubric. Use it for subjective quality tasks where exact match fails, but always calibrate it against a human-labeled golden set of 30–50 examples first.
How does AI output benchmarking connect to CI/CD pipelines?
Benchmark suites run as automated checks on every model or prompt change, gating deployments when results drop below defined thresholds. This prevents silent regressions from reaching production users.